
Cigna trades at $313 per share and has moved almost in lockstep with the market over the last six months. The stock has lost 7.3% while the S&P 500 is down 2.5%. This may have investors wondering how to approach the situation.
Following the pullback, is this a buying opportunity for CI? Find out in our full research report, it’s free.
Why Does Cigna Spark Debate?
With roots dating back to 1792 and serving millions of customers across the globe, The Cigna Group (NYSE: CI) provides healthcare services through its Evernorth Health Services and Cigna Healthcare segments, offering pharmacy benefits, specialty care, and medical plans.
Two Positive Attributes:
1. Long-Term Revenue Growth Shows Momentum
A company’s long-term sales performance is one signal of its overall quality. Any business can put up a good quarter or two, but the best consistently grow over the long haul. Over the last five years, Cigna grew its sales at a decent 12% compounded annual growth rate. Its growth was slightly above the average healthcare company and shows its offerings resonate with customers. 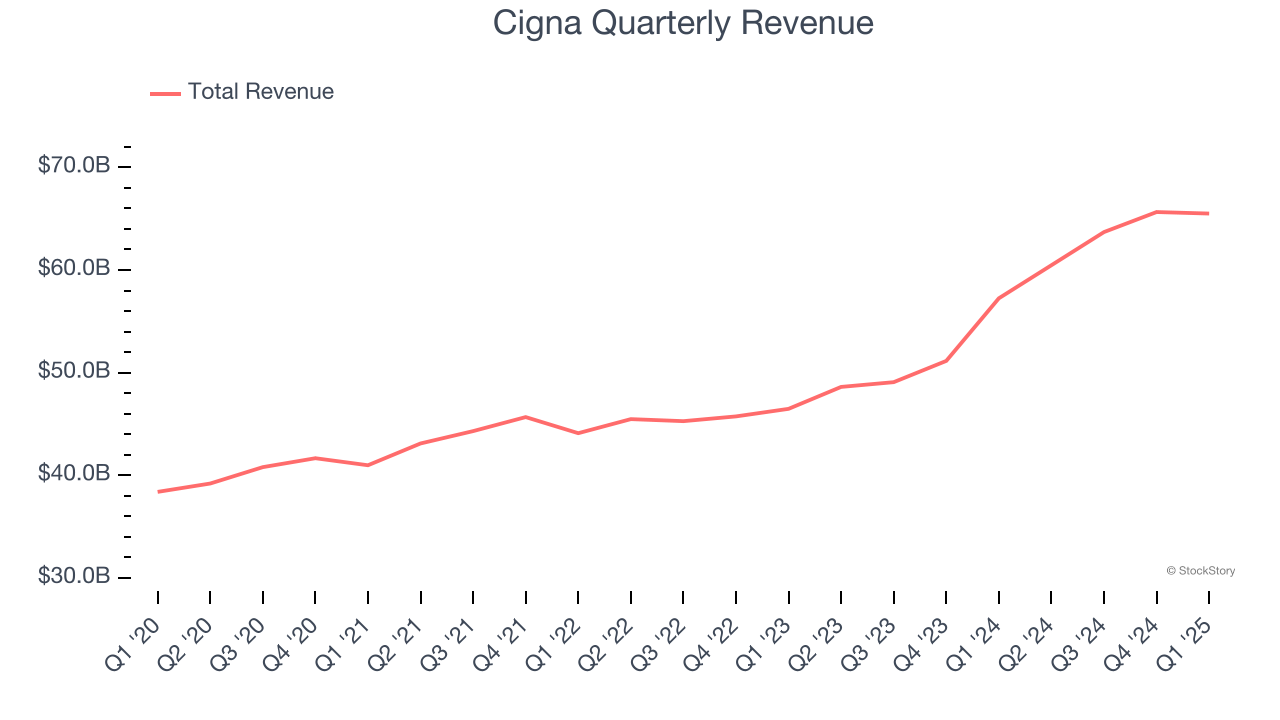
2. Economies of Scale Give It Negotiating Leverage with Suppliers
Larger companies benefit from economies of scale, where fixed costs like infrastructure, technology, and administration are spread over a higher volume of goods or services, reducing the cost per unit. Scale can also lead to bargaining power with suppliers, greater brand recognition, and more investment firepower. A virtuous cycle can ensue if a scaled company plays its cards right.
With $255.3 billion in revenue over the past 12 months, Cigna is one of the most scaled enterprises in healthcare. This is particularly important because health insurance providers companies are volume-driven businesses due to their low margins.
One Reason to be Careful:
Weak Customer Growth Points to Soft Demand
Revenue growth can be broken down into the number of customers and the average spend per customer. Both are important because an increasing customer base leads to more upselling opportunities while the revenue per customer shows how successful a company was in executing its upselling strategy.
Cigna’s total customers came in at 16.36 million in the latest quarter, and over the last two years, their count averaged 2.1% year-on-year growth. This performance slightly lagged the sector and suggests that increasing competition is causing challenges in landing new contracts. 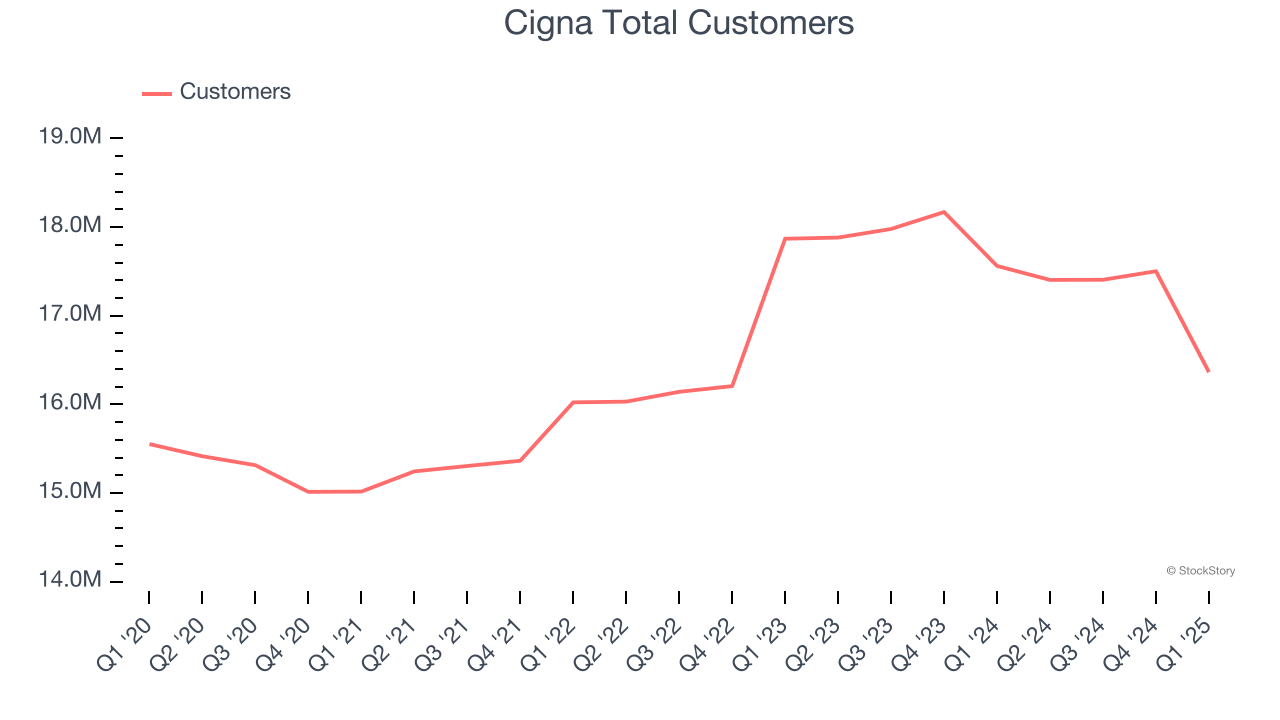
Final Judgment
Cigna has huge potential even though it has some open questions. With the recent decline, the stock trades at 10.1× forward P/E (or $313 per share). Is now a good time to buy? See for yourself in our in-depth research report, it’s free.
High-Quality Stocks for All Market Conditions
The market surged in 2024 and reached record highs after Donald Trump’s presidential victory in November, but questions about new economic policies are adding much uncertainty for 2025.
While the crowd speculates what might happen next, we’re homing in on the companies that can succeed regardless of the political or macroeconomic environment. Put yourself in the driver’s seat and build a durable portfolio by checking out our Top 6 Stocks for this week. This is a curated list of our High Quality stocks that have generated a market-beating return of 183% over the last five years (as of March 31st 2025).
Stocks that made our list in 2020 include now familiar names such as Nvidia (+1,545% between March 2020 and March 2025) as well as under-the-radar businesses like the once-small-cap company Comfort Systems (+782% five-year return). Find your next big winner with StockStory today.