
Electronics retailer Best Buy (NYSE: BBY) met Wall Street’s revenue expectations in Q1 CY2025, but sales were flat year on year at $8.77 billion. The company’s outlook for the full year was close to analysts’ estimates with revenue guided to $41.5 billion at the midpoint. Its non-GAAP profit of $1.15 per share was 5% above analysts’ consensus estimates.
Is now the time to buy Best Buy? Find out by accessing our full research report, it’s free.
Best Buy (BBY) Q1 CY2025 Highlights:
- Revenue: $8.77 billion vs analyst estimates of $8.80 billion (flat year on year, in line)
- Adjusted EPS: $1.15 vs analyst estimates of $1.09 (5% beat)
- Adjusted EBITDA: $470 million vs analyst estimates of $524.7 million (5.4% margin, 10.4% miss)
- The company dropped its revenue guidance for the full year to $41.5 billion at the midpoint from $41.8 billion, a 0.7% decrease
- Management lowered its full-year Adjusted EPS guidance to $6.23 at the midpoint, a 2.7% decrease
- Operating Margin: 2.5%, down from 3.5% in the same quarter last year
- Free Cash Flow was -$132 million, down from $4 million in the same quarter last year
- Same-Store Sales were flat year on year (-6.1% in the same quarter last year)
- Market Capitalization: $15.14 billion
Company Overview
With humble beginnings as a stereo equipment seller, Best Buy (NYSE: BBY) now sells a broad selection of consumer electronics, appliances, and home office products.
Sales Growth
A company’s long-term sales performance is one signal of its overall quality. Even a bad business can shine for one or two quarters, but a top-tier one grows for years.
With $41.45 billion in revenue over the past 12 months, Best Buy is larger than most consumer retail companies and benefits from economies of scale, enabling it to gain more leverage on its fixed costs than smaller competitors. This also gives it the flexibility to offer lower prices. However, its scale is a double-edged sword because there are only a finite number of places to build new stores, making it harder to find incremental growth. For Best Buy to boost its sales, it likely needs to adjust its prices or lean into foreign markets.
As you can see below, Best Buy struggled to increase demand as its $41.45 billion of sales for the trailing 12 months was close to its revenue six years ago (we compare to 2019 to normalize for COVID-19 impacts). This was mainly because it didn’t open many new stores and observed lower sales at existing, established locations.
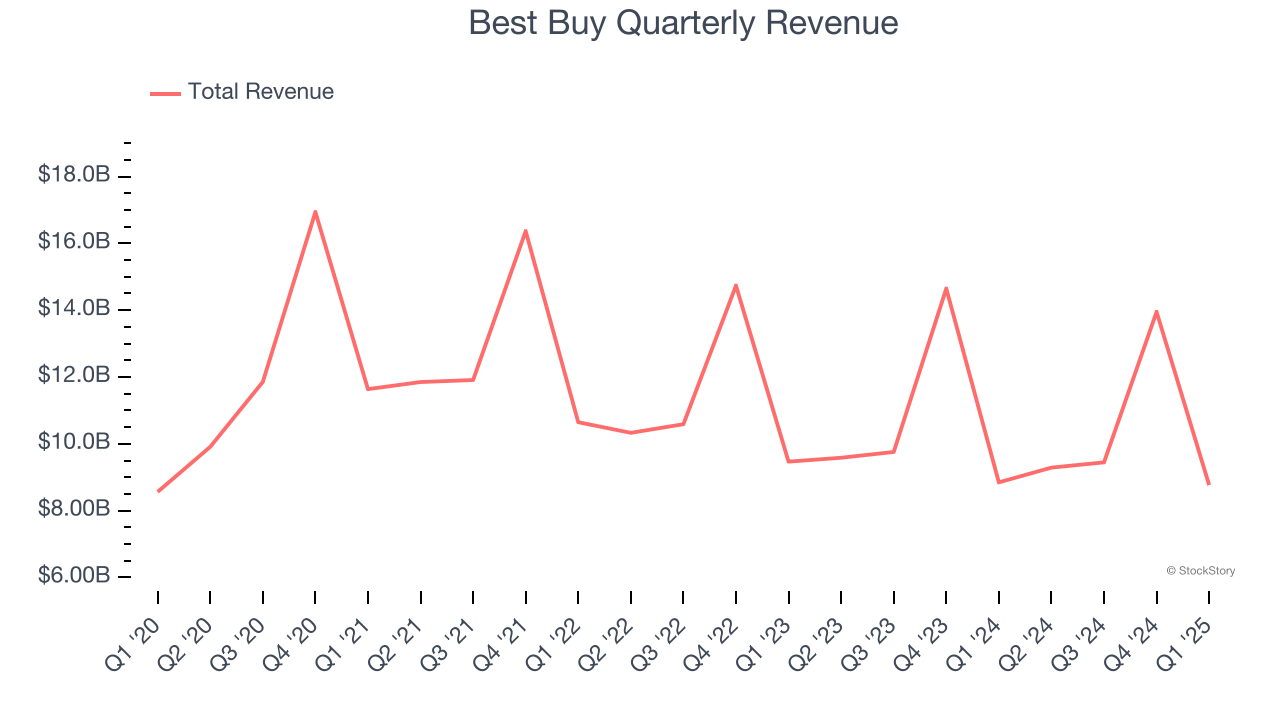
This quarter, Best Buy’s $8.77 billion of revenue was flat year on year and in line with Wall Street’s estimates.
Looking ahead, sell-side analysts expect revenue to remain flat over the next 12 months. This projection is underwhelming and implies its newer products will not lead to better top-line performance yet.
Here at StockStory, we certainly understand the potential of thematic investing. Diverse winners from Microsoft (MSFT) to Alphabet (GOOG), Coca-Cola (KO) to Monster Beverage (MNST) could all have been identified as promising growth stories with a megatrend driving the growth. So, in that spirit, we’ve identified a relatively under-the-radar profitable growth stock benefiting from the rise of AI, available to you FREE via this link.
Store Performance
Number of Stores
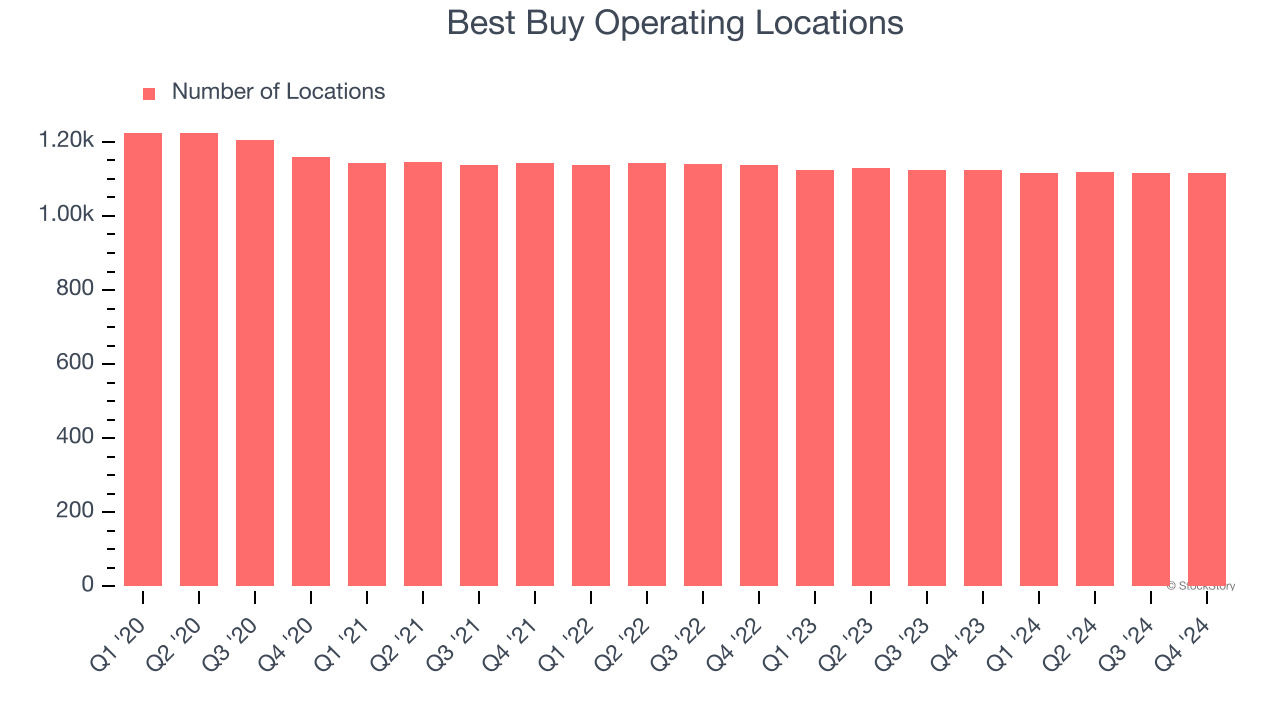
A retailer’s store count often determines how much revenue it can generate.
Over the last two years, Best Buy has kept its store count flat while other consumer retail businesses have opted for growth.
When a retailer keeps its store footprint steady, it usually means demand is stable and it’s focusing on operational efficiency to increase profitability.
Note that Best Buy reports its store count intermittently, so some data points are missing in the chart below.
Same-Store Sales
A company's store base only paints one part of the picture. When demand is high, it makes sense to open more. But when demand is low, it’s prudent to close some locations and use the money in other ways. Same-store sales gives us insight into this topic because it measures organic growth for a retailer's e-commerce platform and brick-and-mortar shops that have existed for at least a year.
Best Buy’s demand has been shrinking over the last two years as its same-store sales have averaged 3.7% annual declines. This performance isn’t ideal, and we’d be concerned if Best Buy starts opening new stores to artificially boost revenue growth.
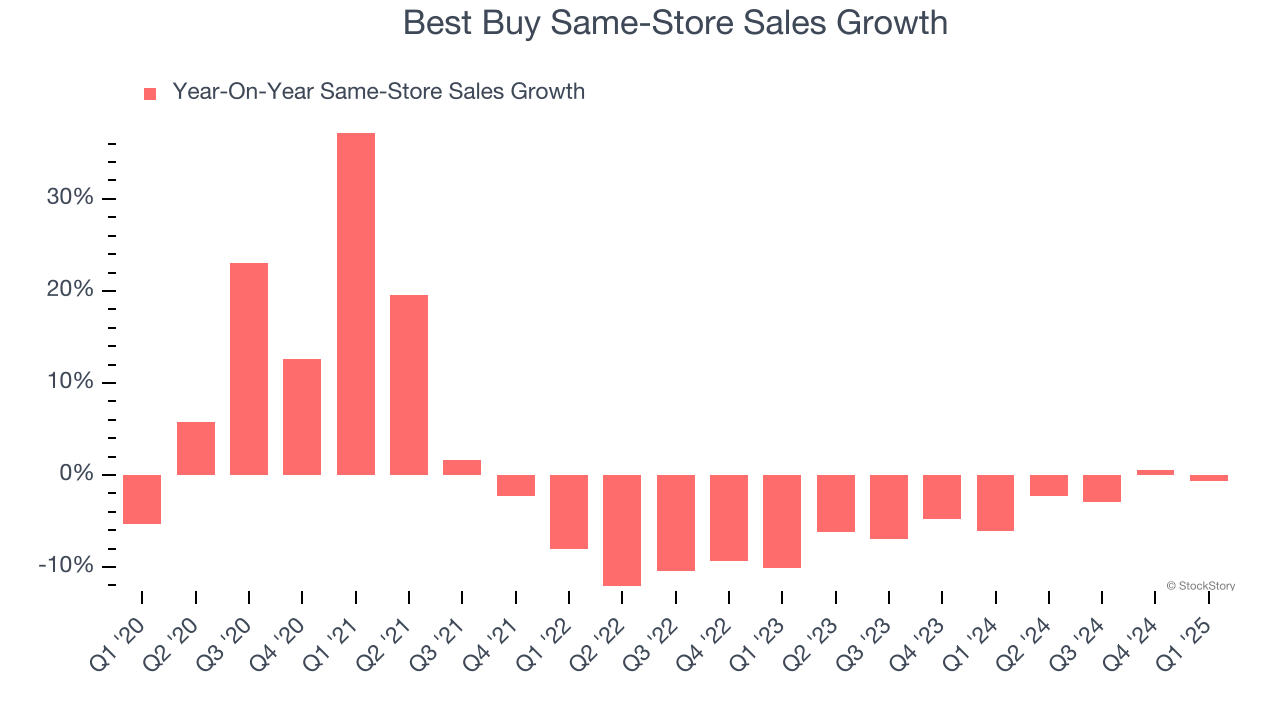
In the latest quarter, Best Buy’s year on year same-store sales were flat. This performance was a well-appreciated turnaround from its historical levels, showing the business is improving.
Key Takeaways from Best Buy’s Q1 Results
It was encouraging to see Best Buy beat analysts’ EPS expectations this quarter. On the other hand, its EBITDA missed and it lowered its full-year revenue and EPS guidance. Overall, this quarter could have been better. The stock traded down 2.9% to $69.50 immediately after reporting.
Best Buy’s latest earnings report disappointed. One quarter doesn’t define a company’s quality, so let’s explore whether the stock is a buy at the current price. We think that the latest quarter is only one piece of the longer-term business quality puzzle. Quality, when combined with valuation, can help determine if the stock is a buy. We cover that in our actionable full research report which you can read here, it’s free.
