Footwear company Caleres (NYSE: CAL) missed Wall Street’s revenue expectations in Q1 CY2025, with sales falling 6.8% year on year to $614.2 million. Its non-GAAP profit of $0.22 per share was 39.7% below analysts’ consensus estimates.
Is now the time to buy Caleres? Find out by accessing our full research report, it’s free.
Caleres (CAL) Q1 CY2025 Highlights:
- Revenue: $614.2 million vs analyst estimates of $622 million (6.8% year-on-year decline, 1.3% miss)
- Adjusted EPS: $0.22 vs analyst expectations of $0.37 (39.7% miss)
- Adjusted EBITDA: $28.68 million vs analyst estimates of $34.53 million (4.7% margin, 16.9% miss)
- Operating Margin: 1.9%, down from 6.6% in the same quarter last year
- Free Cash Flow was -$26.8 million, down from $26.27 million in the same quarter last year
- Market Capitalization: $558.4 million
“While our brands continue to resonate with consumers and both segments of our business gained market share in the period, our first quarter results fell short of expectations. February sales were particularly weak, and although trends improved in March and April, overall performance was below plan. Furthermore, operating earnings were pressured by lower gross margins, increased reserves, and costs to cancel and move inventory,” said Jay Schmidt, president and chief executive officer.
Company Overview
The owner of Dr. Scholl's, Caleres (NYSE: CAL) is a footwear company offering a range of styles.
Sales Growth
Reviewing a company’s long-term sales performance reveals insights into its quality. Any business can have short-term success, but a top-tier one grows for years. Unfortunately, Caleres struggled to consistently increase demand as its $2.68 billion of sales for the trailing 12 months was close to its revenue five years ago. This wasn’t a great result and suggests it’s a low quality business.
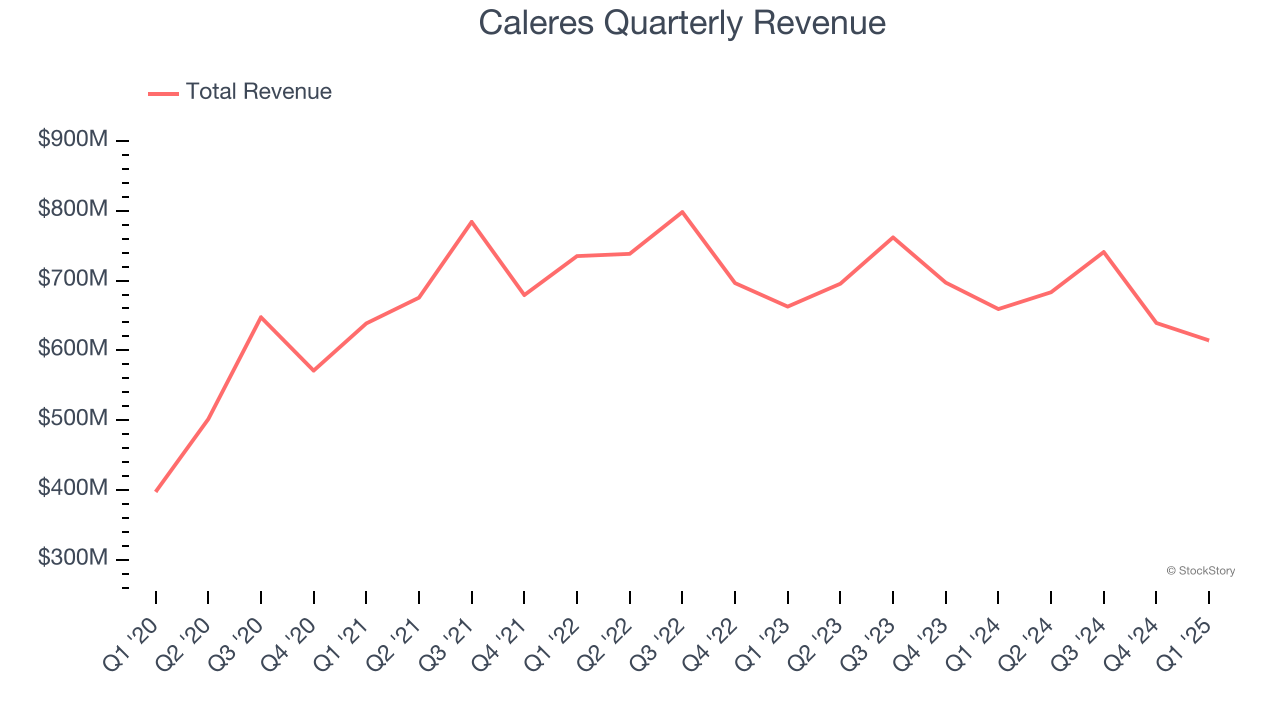
We at StockStory place the most emphasis on long-term growth, but within consumer discretionary, a stretched historical view may miss a company riding a successful new product or trend. Caleres’s recent performance shows its demand remained suppressed as its revenue has declined by 3.8% annually over the last two years. 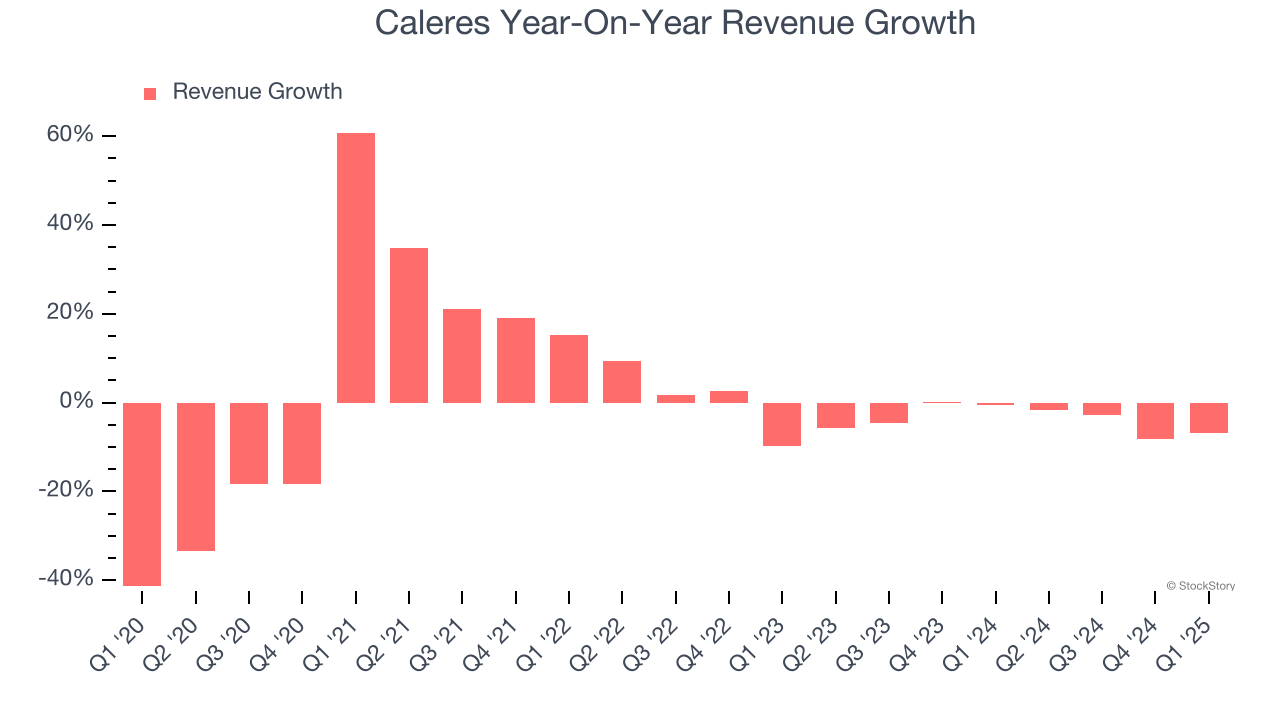
This quarter, Caleres missed Wall Street’s estimates and reported a rather uninspiring 6.8% year-on-year revenue decline, generating $614.2 million of revenue.
Looking ahead, sell-side analysts expect revenue to grow 1.9% over the next 12 months. While this projection implies its newer products and services will fuel better top-line performance, it is still below the sector average.
Unless you’ve been living under a rock, it should be obvious by now that generative AI is going to have a huge impact on how large corporations do business. While Nvidia and AMD are trading close to all-time highs, we prefer a lesser-known (but still profitable) stock benefiting from the rise of AI. Click here to access our free report one of our favorites growth stories.
Operating Margin
Caleres’s operating margin has been trending down over the last 12 months and averaged 5.8% over the last two years. The company’s profitability was mediocre for a consumer discretionary business and shows it couldn’t pass its higher operating expenses onto its customers.
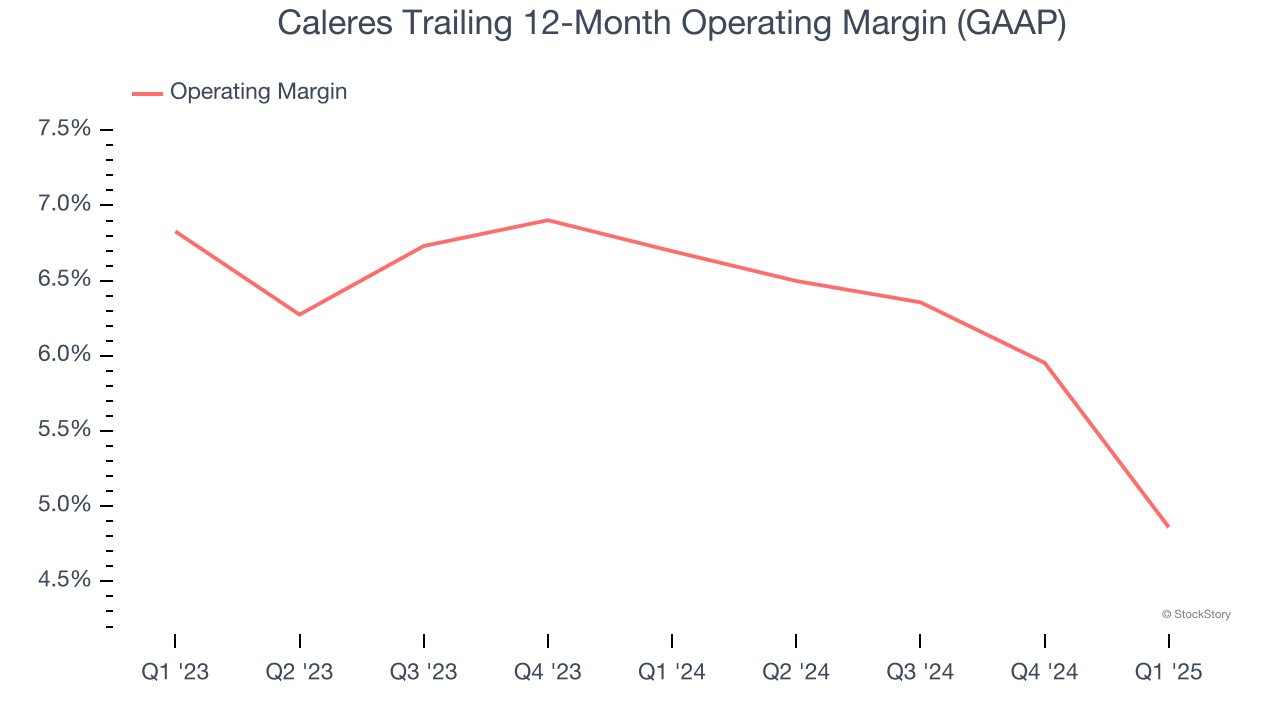
This quarter, Caleres generated an operating profit margin of 1.9%, down 4.7 percentage points year on year. This contraction shows it was less efficient because its expenses increased relative to its revenue.
Earnings Per Share
Revenue trends explain a company’s historical growth, but the long-term change in earnings per share (EPS) points to the profitability of that growth – for example, a company could inflate its sales through excessive spending on advertising and promotions.
Caleres’s EPS grew at an astounding 43% compounded annual growth rate over the last five years, higher than its flat revenue. This tells us management responded to softer demand by adapting its cost structure.
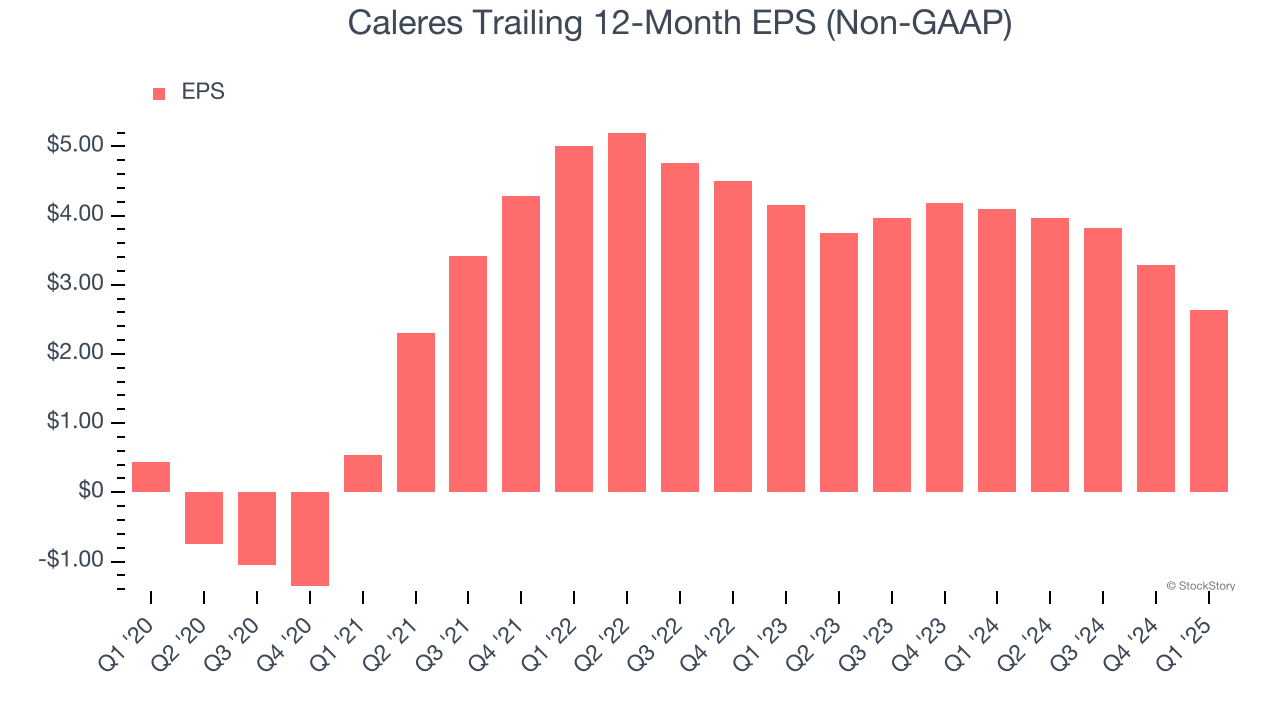
In Q1, Caleres reported EPS at $0.22, down from $0.88 in the same quarter last year. This print missed analysts’ estimates, but we care more about long-term EPS growth than short-term movements. Over the next 12 months, Wall Street expects Caleres’s full-year EPS of $2.63 to grow 16.8%.
Key Takeaways from Caleres’s Q1 Results
We struggled to find many positives in these results as its revenue, EPS, and EBITDA fell short of Wall Street’s estimates. Overall, this was a weaker quarter. The stock traded down 5.6% to $15.47 immediately after reporting.
Caleres didn’t show it’s best hand this quarter, but does that create an opportunity to buy the stock right now? When making that decision, it’s important to consider its valuation, business qualities, as well as what has happened in the latest quarter. We cover that in our actionable full research report which you can read here, it’s free.