Nutrition products company Bellring Brands (NYSE: BRBR) beat Wall Street’s revenue expectations in Q1 CY2025, with sales up 18.9% year on year to $588 million. On the other hand, the company’s full-year revenue guidance of $2.3 billion at the midpoint came in 0.7% below analysts’ estimates. Its non-GAAP profit of $0.53 per share was in line with analysts’ consensus estimates.
Is now the time to buy BellRing Brands? Find out by accessing our full research report, it’s free.
BellRing Brands (BRBR) Q1 CY2025 Highlights:
- Revenue: $588 million vs analyst estimates of $579 million (18.9% year-on-year growth, 1.6% beat)
- Adjusted EPS: $0.53 vs analyst estimates of $0.53 (in line)
- Adjusted EBITDA: $118.6 million vs analyst estimates of $118.3 million (20.2% margin, in line)
- The company reconfirmed its revenue guidance for the full year of $2.3 billion at the midpoint
- EBITDA guidance for the full year is $485 million at the midpoint, below analyst estimates of $491.5 million
- Operating Margin: 16.2%, down from 18.4% in the same quarter last year
- Organic Revenue rose 21.2% year on year (28.3% in the same quarter last year)
- Sales Volumes rose 17.8% year on year (42.7% in the same quarter last year)
- Market Capitalization: $10.12 billion
Company Overview
Spun out of Post Holdings in 2019, Bellring Brands (NYSE: BRBR) offers protein shakes, nutrition bars, and other products under the PowerBar, Premier Protein, and Dymatize brands.
Sales Growth
A company’s long-term performance is an indicator of its overall quality. Even a bad business can shine for one or two quarters, but a top-tier one grows for years.
With $2.19 billion in revenue over the past 12 months, BellRing Brands is a small consumer staples company, which sometimes brings disadvantages compared to larger competitors benefiting from economies of scale and negotiating leverage with retailers. On the bright side, it can grow faster because it has a longer list of untapped store chains to sell into.
As you can see below, BellRing Brands’s 18.9% annualized revenue growth over the last three years was impressive as consumers bought more of its products.
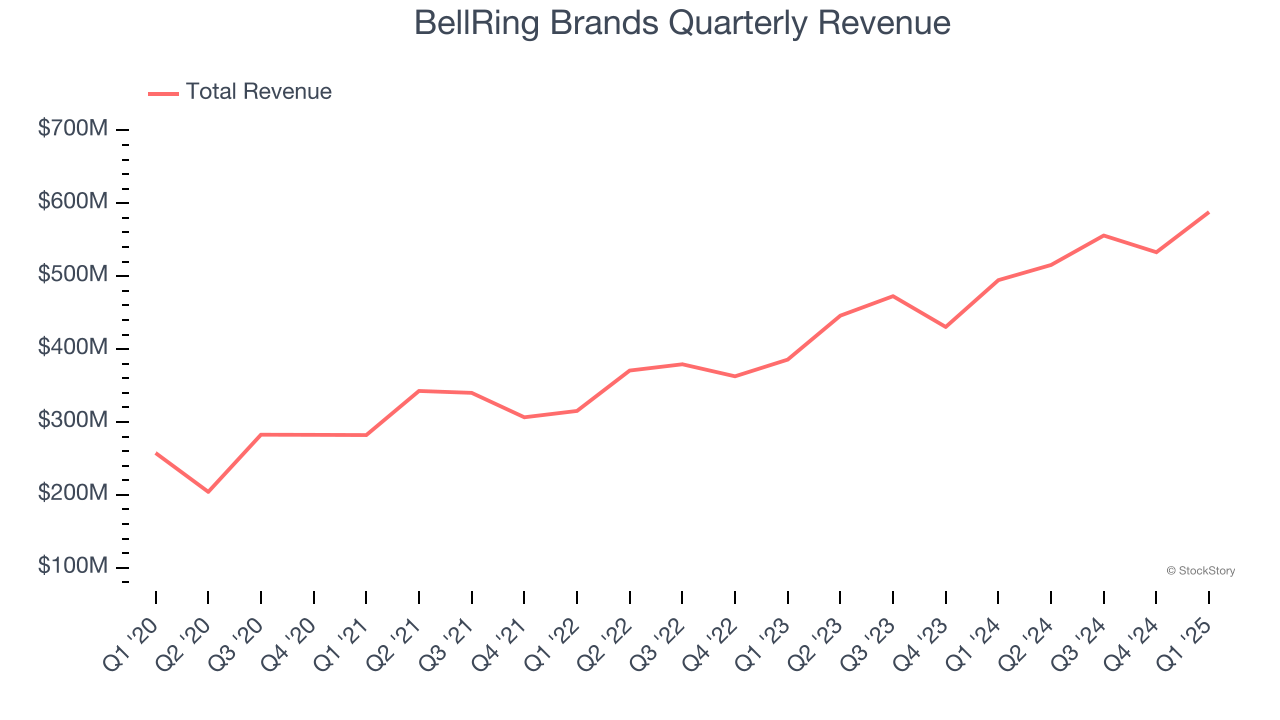
This quarter, BellRing Brands reported year-on-year revenue growth of 18.9%, and its $588 million of revenue exceeded Wall Street’s estimates by 1.6%.
Looking ahead, sell-side analysts expect revenue to grow 11.1% over the next 12 months, a deceleration versus the last three years. Despite the slowdown, this projection is commendable and implies the market is baking in success for its products.
Unless you’ve been living under a rock, it should be obvious by now that generative AI is going to have a huge impact on how large corporations do business. While Nvidia and AMD are trading close to all-time highs, we prefer a lesser-known (but still profitable) stock benefiting from the rise of AI. Click here to access our free report one of our favorites growth stories.
Volume Growth
Revenue growth can be broken down into changes in price and volume (the number of units sold). While both are important, volume is the lifeblood of a successful staples business as there’s a ceiling to what consumers will pay for everyday goods; they can always trade down to non-branded products if the branded versions are too expensive.
To analyze whether BellRing Brands generated its growth from changes in price or volume, we can compare its volume growth to its organic revenue growth, which excludes non-fundamental impacts on company financials like mergers and currency fluctuations.
Over the last two years, BellRing Brands’s average quarterly volume growth of 20.8% has outpaced the competition by a long shot. In the context of its 21.3% average organic revenue growth, we can see that most of the company’s gains have come from more customers purchasing its products.
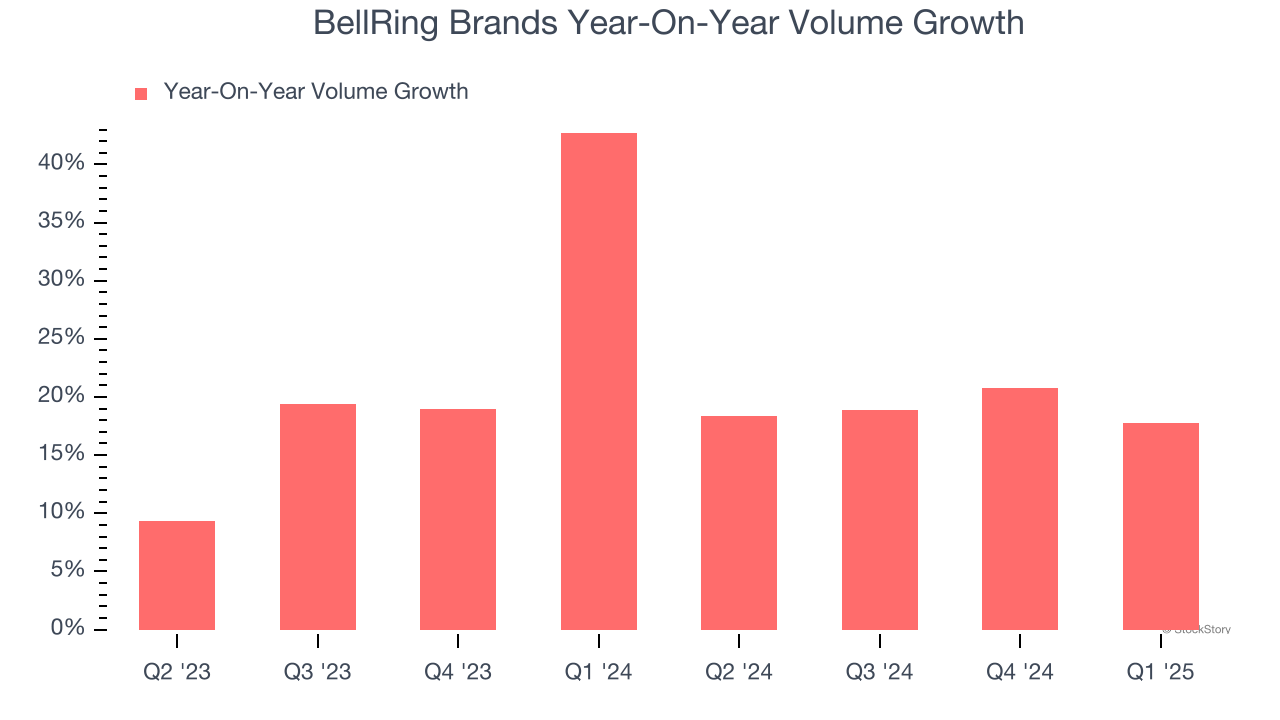
In BellRing Brands’s Q1 2025, sales volumes jumped 17.8% year on year. This result shows the business is staying on track, but the deceleration suggests growth is getting harder to come by.
Key Takeaways from BellRing Brands’s Q1 Results
We were impressed by how significantly BellRing Brands blew past analysts’ organic revenue expectations this quarter. We were also happy its revenue outperformed Wall Street’s estimates. On the other hand, its full-year revenue guidance fell slightly short of Wall Street’s estimates. Zooming out, we think this was a decent quarter featuring some areas of strength but also some blemishes. The areas below expectations seem to be driving the move, and the stock traded down 9% to $71.45 immediately following the results.
So do we think BellRing Brands is an attractive buy at the current price? If you’re making that decision, you should consider the bigger picture of valuation, business qualities, as well as the latest earnings. We cover that in our actionable full research report which you can read here, it’s free.