Hospitality company Playa Hotels & Resorts (NASDAQ: PLYA) met Wall Street’s revenue expectations in Q1 CY2025, but sales fell by 11.1% year on year to $267.3 million. Its non-GAAP profit of $0.37 per share was 12% above analysts’ consensus estimates.
Is now the time to buy Playa Hotels & Resorts? Find out by accessing our full research report, it’s free.
Playa Hotels & Resorts (PLYA) Q1 CY2025 Highlights:
- Revenue: $267.3 million vs analyst estimates of $267.3 million (11.1% year-on-year decline, in line)
- Adjusted EPS: $0.37 vs analyst estimates of $0.33 (12% beat)
- Adjusted EBITDA: $85.8 million vs analyst estimates of $87.84 million (32.1% margin, 2.3% miss)
- Operating Margin: 24.5%, down from 30% in the same quarter last year
- RevPAR: $449.14 at quarter end, up 5.1% year on year
- Market Capitalization: $1.72 billion
Company Overview
Sporting a roster of beachfront properties, Playa Hotels & Resorts (NASDAQ: PLYA) is an owner, operator, and developer of all-inclusive resorts in prime vacation destinations.
Sales Growth
Reviewing a company’s long-term sales performance reveals insights into its quality. Any business can experience short-term success, but top-performing ones enjoy sustained growth for years. Unfortunately, Playa Hotels & Resorts’s 7.9% annualized revenue growth over the last five years was sluggish. This was below our standard for the consumer discretionary sector and is a tough starting point for our analysis.
We at StockStory place the most emphasis on long-term growth, but within consumer discretionary, a stretched historical view may miss a company riding a successful new property or trend. Playa Hotels & Resorts’s recent performance shows its demand has slowed as its revenue was flat over the last two years. 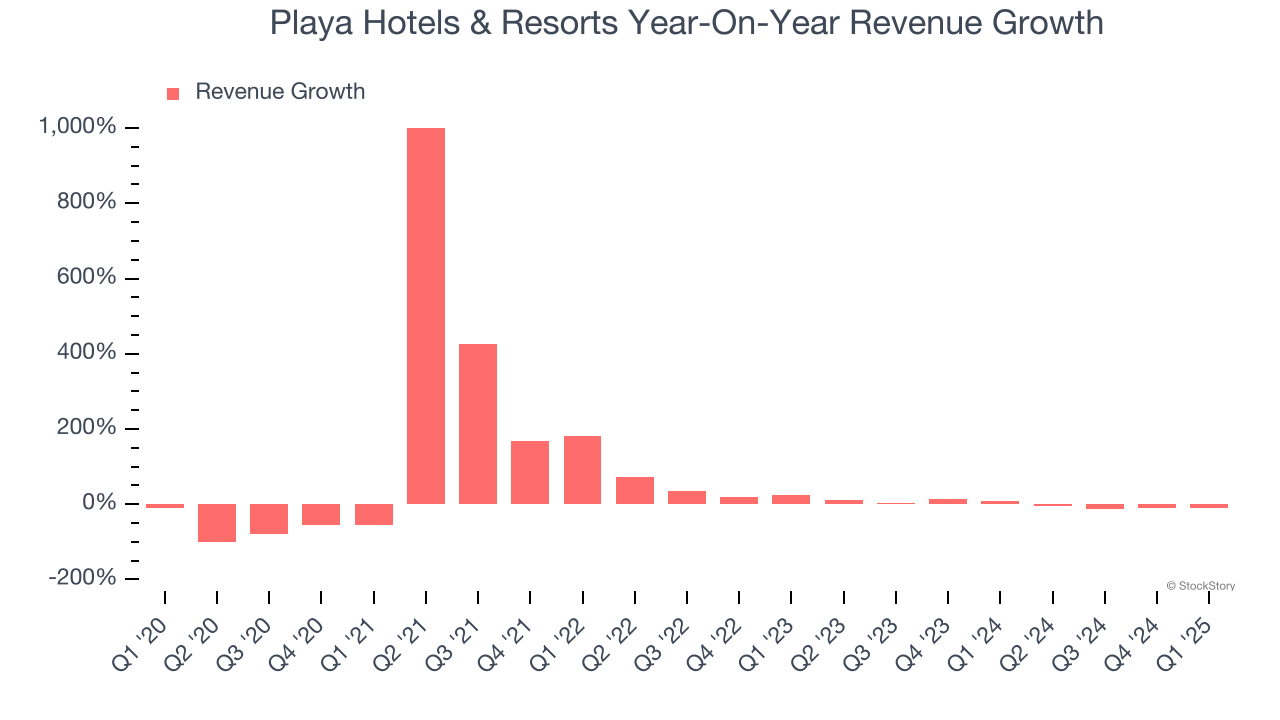
We can dig further into the company’s revenue dynamics by analyzing its revenue per available room, which clocked in at $449.14 this quarter and is a key metric accounting for daily rates and occupancy levels. Over the last two years, Playa Hotels & Resorts’s revenue per room averaged 7.8% year-on-year growth. Because this number is better than its revenue growth, we can see its room bookings outperformed its sales from other areas like restaurants, bars, and amenities. 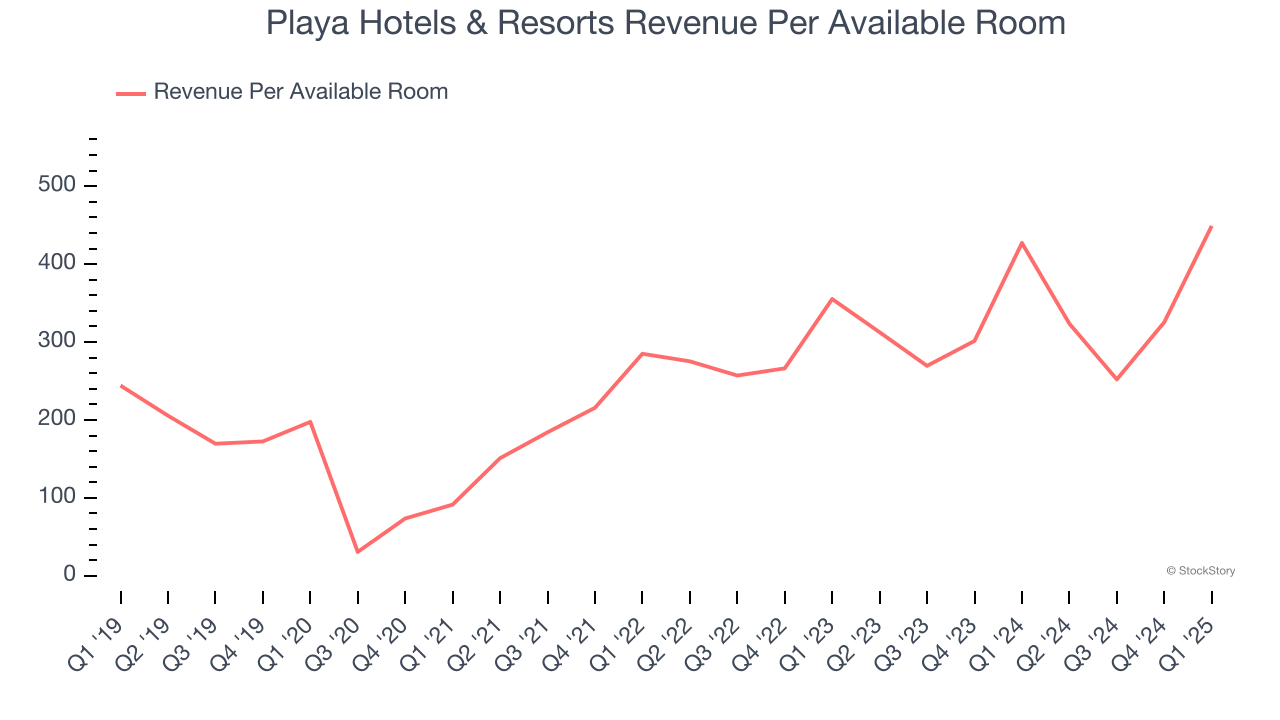
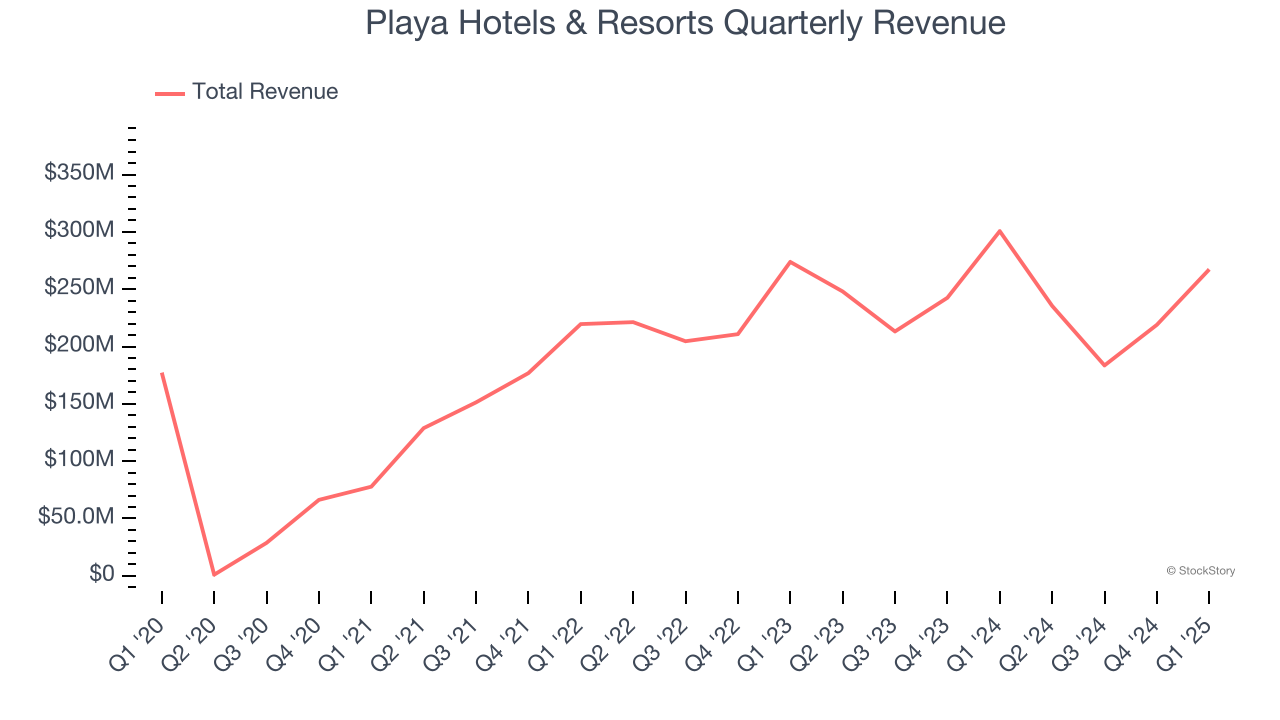
This quarter, Playa Hotels & Resorts reported a rather uninspiring 11.1% year-on-year revenue decline to $267.3 million of revenue, in line with Wall Street’s estimates.
Looking ahead, sell-side analysts expect revenue to grow 8.8% over the next 12 months. While this projection indicates its newer products and services will fuel better top-line performance, it is still below the sector average.
Unless you’ve been living under a rock, it should be obvious by now that generative AI is going to have a huge impact on how large corporations do business. While Nvidia and AMD are trading close to all-time highs, we prefer a lesser-known (but still profitable) stock benefiting from the rise of AI. Click here to access our free report one of our favorites growth stories.
Operating Margin
Operating margin is a key measure of profitability. Think of it as net income - the bottom line - excluding the impact of taxes and interest on debt, which are less connected to business fundamentals.
Playa Hotels & Resorts’s operating margin has shrunk over the last 12 months, but it still averaged 17.7% over the last two years, top-notch for a consumer discretionary business. This shows it’s an efficient company that manages its expenses effectively.
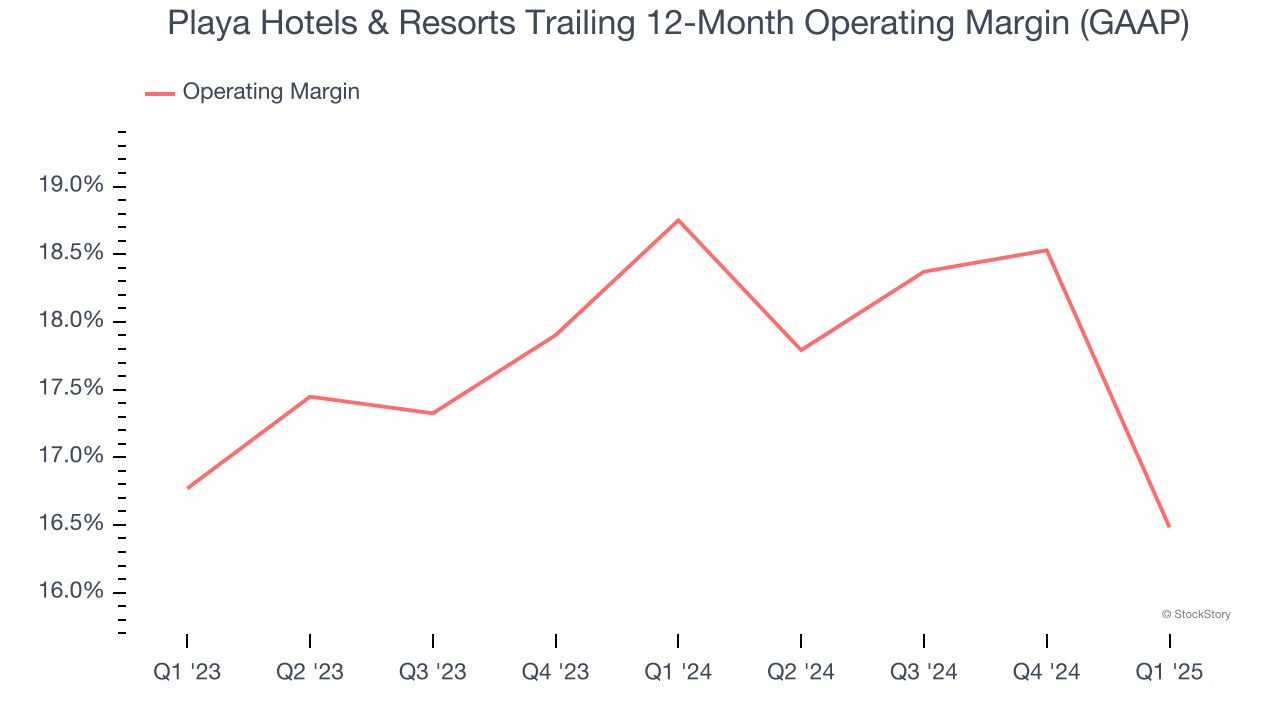
In Q1, Playa Hotels & Resorts generated an operating profit margin of 24.5%, down 5.5 percentage points year on year. This contraction shows it was less efficient because its expenses increased relative to its revenue.
Earnings Per Share
Revenue trends explain a company’s historical growth, but the long-term change in earnings per share (EPS) points to the profitability of that growth – for example, a company could inflate its sales through excessive spending on advertising and promotions.
Playa Hotels & Resorts’s full-year EPS flipped from negative to positive over the last five years. This is encouraging and shows it’s at a critical moment in its life.
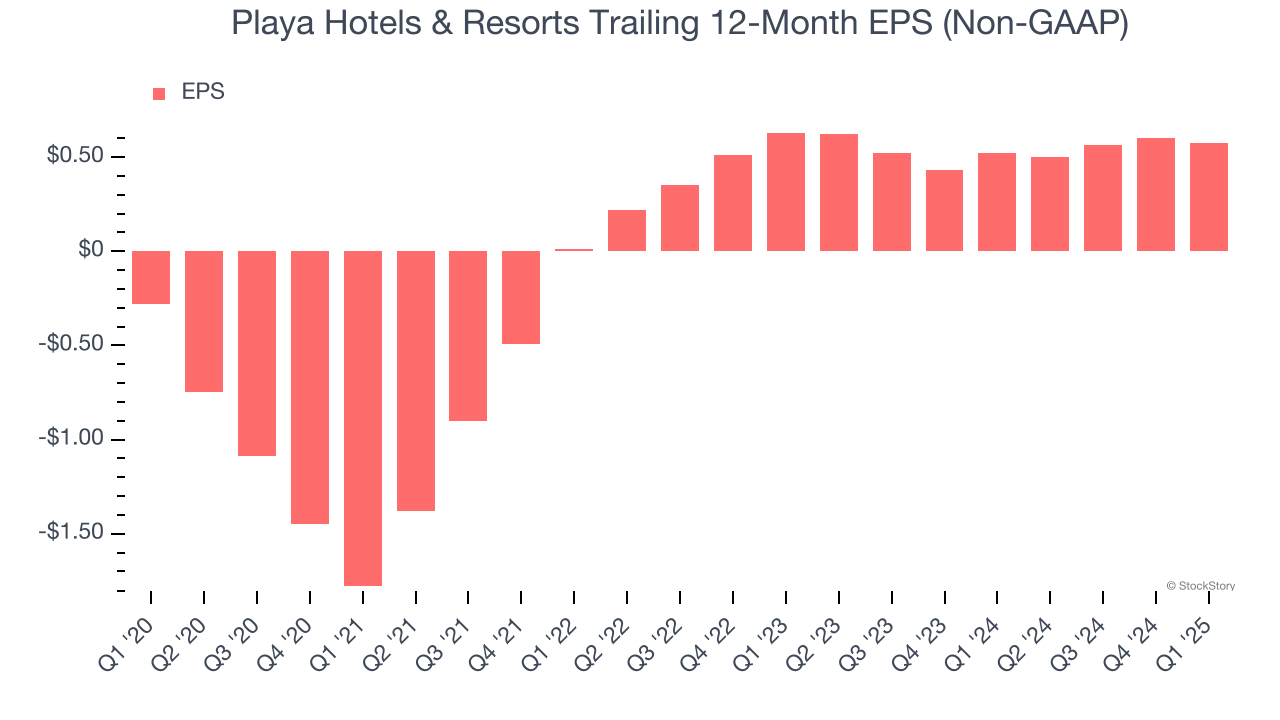
In Q1, Playa Hotels & Resorts reported EPS at $0.37, down from $0.40 in the same quarter last year. Despite falling year on year, this print easily cleared analysts’ estimates. Over the next 12 months, Wall Street expects Playa Hotels & Resorts’s full-year EPS of $0.57 to grow 8.5%.
Key Takeaways from Playa Hotels & Resorts’s Q1 Results
It was encouraging to see Playa Hotels & Resorts beat analysts’ EPS expectations this quarter. On the other hand, its EBITDA missed. Overall, this print was mixed. The stock remained flat at $13.42 immediately after reporting.
Big picture, is Playa Hotels & Resorts a buy here and now? We think that the latest quarter is only one piece of the longer-term business quality puzzle. Quality, when combined with valuation, can help determine if the stock is a buy. We cover that in our actionable full research report which you can read here, it’s free.