
Biotech company Vertex Pharmaceuticals (NASDAQ: VRTX) missed Wall Street’s revenue expectations in Q1 CY2025 as sales rose 3% year on year to $2.77 billion. The company’s full-year revenue guidance of $11.88 billion at the midpoint came in 0.9% below analysts’ estimates. Its non-GAAP profit of $4.06 per share was 5.4% below analysts’ consensus estimates.
Is now the time to buy Vertex Pharmaceuticals? Find out by accessing our full research report, it’s free.
Vertex Pharmaceuticals (VRTX) Q1 CY2025 Highlights:
- Revenue: $2.77 billion vs analyst estimates of $2.83 billion (3% year-on-year growth, 2.3% miss)
- Adjusted EPS: $4.06 vs analyst expectations of $4.29 (5.4% miss)
- Adjusted Operating Income: $1.18 billion vs analyst estimates of $1.30 billion (42.7% margin, 9.1% miss)
- The company reconfirmed its revenue guidance for the full year of $11.88 billion at the midpoint
- Operating Margin: 22.7%, down from 42.4% in the same quarter last year
- Market Capitalization: $128.8 billion
“Vertex delivered a strong start to 2025 with notable execution across the business as we grow and diversify the revenue base, progress multiple launches and advance the R&D pipeline. We continued to expand our leadership in CF and build global momentum for CASGEVY, and we launched JOURNAVX in moderate-to-severe acute pain,” said Reshma Kewalramani, M.D., Chief Executive Officer and President of Vertex.
Company Overview
Founded in 1989 with a mission to create medicines that treat the underlying causes of disease rather than just symptoms, Vertex Pharmaceuticals (NASDAQ: VRTX) develops and markets transformative medicines for serious diseases, with a focus on cystic fibrosis, sickle cell disease, and pain management.
Sales Growth
A company’s long-term sales performance is one signal of its overall quality. Any business can experience short-term success, but top-performing ones enjoy sustained growth for years. Over the last five years, Vertex Pharmaceuticals grew its sales at an impressive 18.2% compounded annual growth rate. Its growth beat the average healthcare company and shows its offerings resonate with customers.
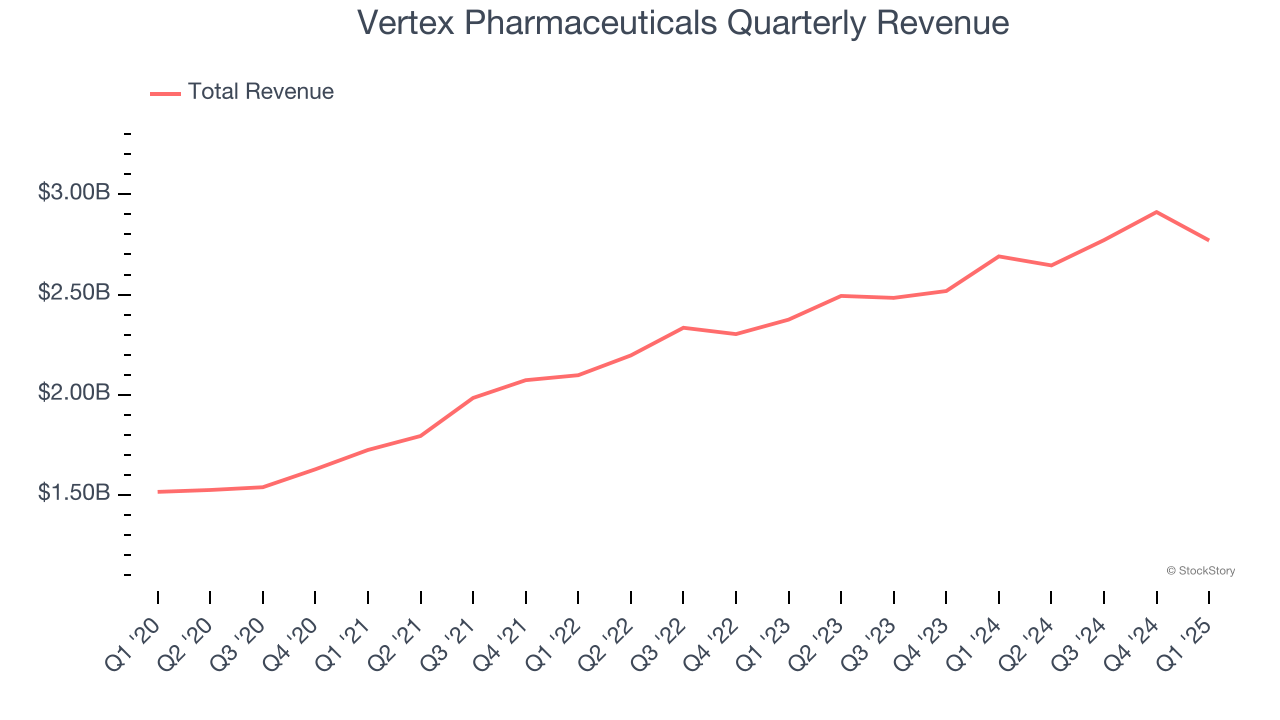
We at StockStory place the most emphasis on long-term growth, but within healthcare, a half-decade historical view may miss recent innovations or disruptive industry trends. Vertex Pharmaceuticals’s annualized revenue growth of 9.8% over the last two years is below its five-year trend, but we still think the results were respectable. 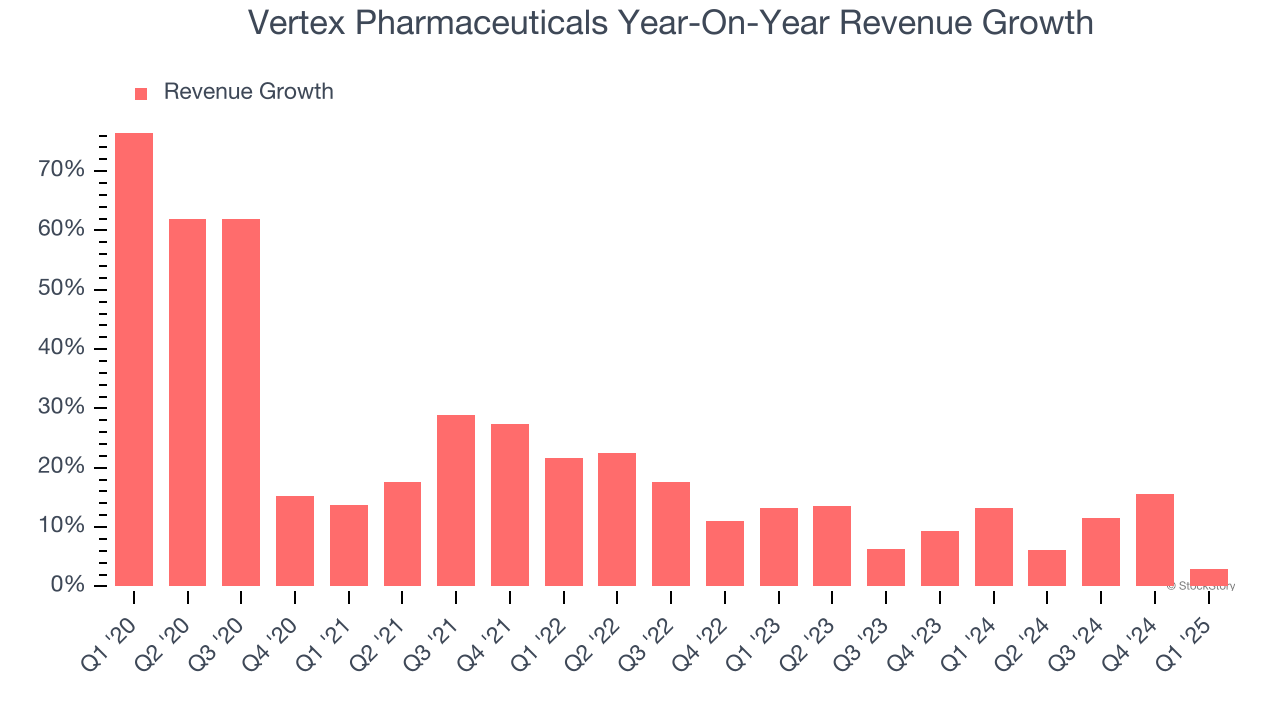
This quarter, Vertex Pharmaceuticals’s revenue grew by 3% year on year to $2.77 billion, falling short of Wall Street’s estimates.
Looking ahead, sell-side analysts expect revenue to grow 9.2% over the next 12 months, similar to its two-year rate. This projection is particularly noteworthy for a company of its scale and suggests the market sees success for its products and services.
Here at StockStory, we certainly understand the potential of thematic investing. Diverse winners from Microsoft (MSFT) to Alphabet (GOOG), Coca-Cola (KO) to Monster Beverage (MNST) could all have been identified as promising growth stories with a megatrend driving the growth. So, in that spirit, we’ve identified a relatively under-the-radar profitable growth stock benefiting from the rise of AI, available to you FREE via this link.
Adjusted Operating Margin
Adjusted operating margin is an important measure of profitability as it shows the portion of revenue left after accounting for all core expenses – everything from the cost of goods sold to advertising and wages. It’s also useful for comparing profitability across companies because it excludes non-recurring expenses, interest on debt, and taxes.
Vertex Pharmaceuticals has been a well-oiled machine over the last five years. It demonstrated elite profitability for a healthcare business, boasting an average adjusted operating margin of 40.1%.
Looking at the trend in its profitability, Vertex Pharmaceuticals’s adjusted operating margin decreased by 51.5 percentage points over the last five years. The company’s two-year trajectory also shows it failed to get its profitability back to the peak as its margin fell by 44.3 percentage points. This performance was poor no matter how you look at it - it shows its expenses were rising and it couldn’t pass those costs onto its customers.
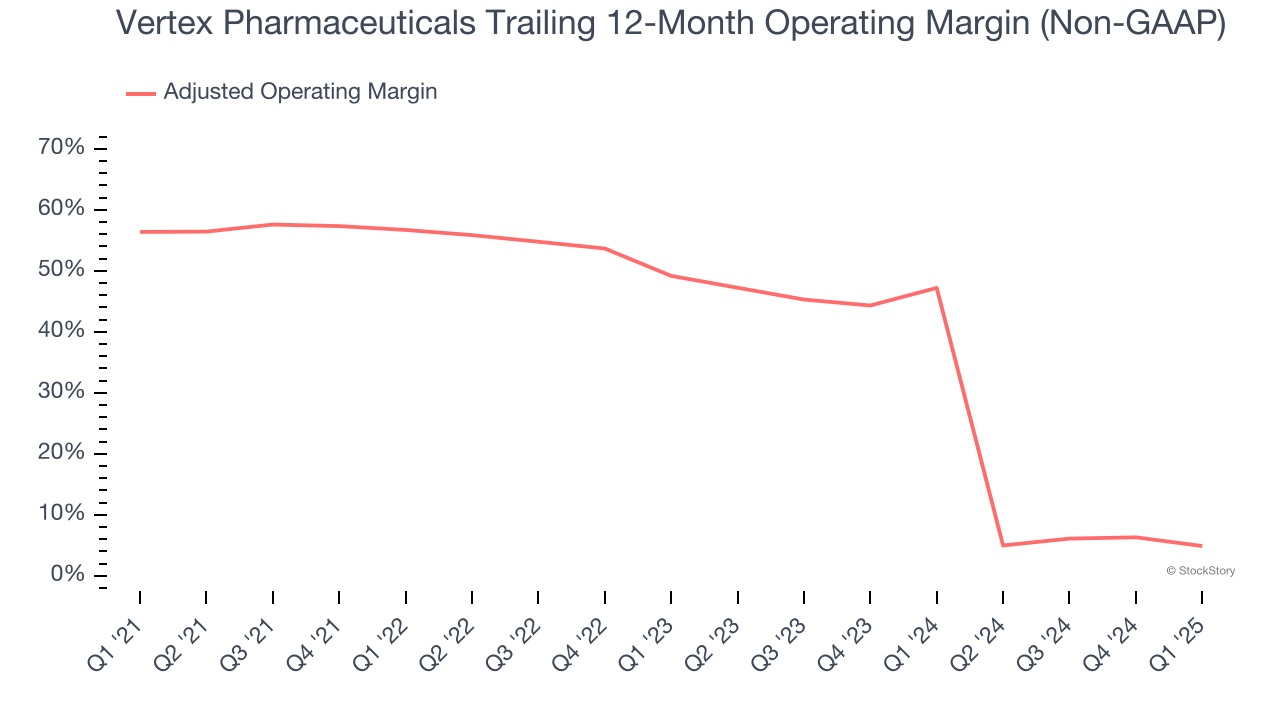
This quarter, Vertex Pharmaceuticals generated an adjusted operating profit margin of 42.7%, down 7 percentage points year on year. This contraction shows it was less efficient because its expenses grew faster than its revenue.
Earnings Per Share
We track the long-term change in earnings per share (EPS) for the same reason as long-term revenue growth. Compared to revenue, however, EPS highlights whether a company’s growth is profitable.
Sadly for Vertex Pharmaceuticals, its EPS declined by 15.6% annually over the last five years while its revenue grew by 18.2%. This tells us the company became less profitable on a per-share basis as it expanded due to non-fundamental factors such as interest expenses and taxes.
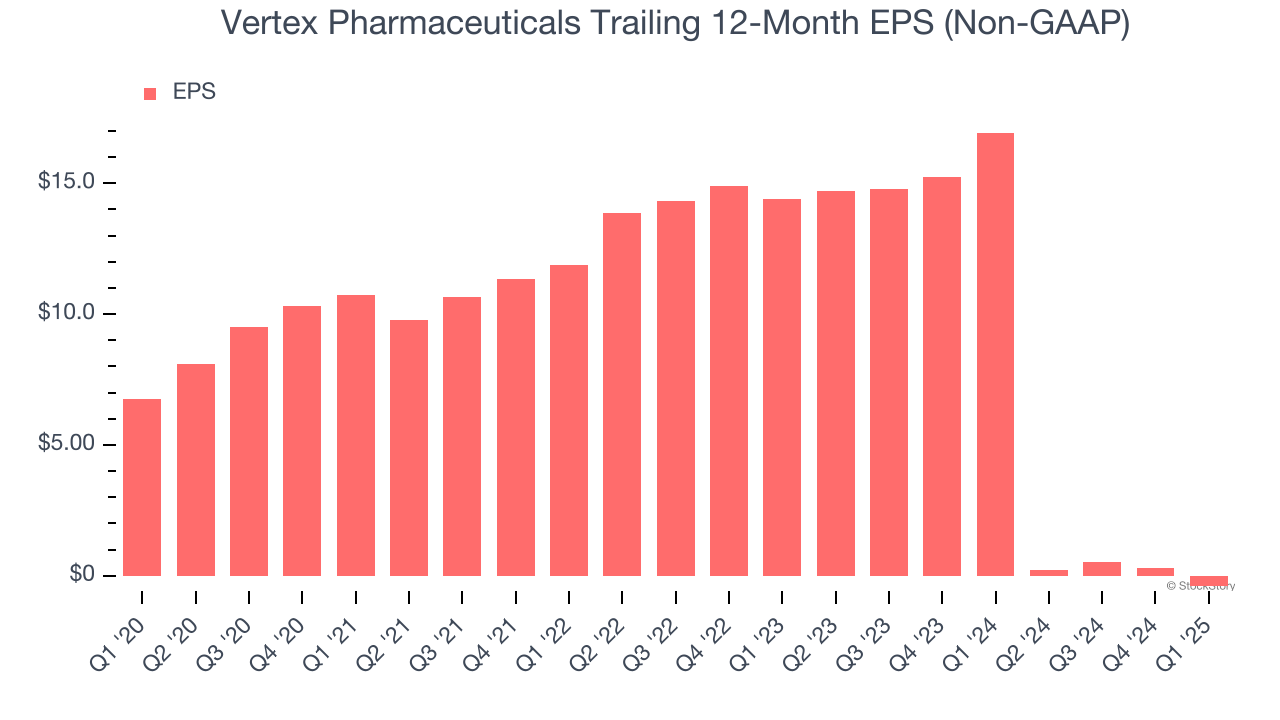
We can take a deeper look into Vertex Pharmaceuticals’s earnings to better understand the drivers of its performance. As we mentioned earlier, Vertex Pharmaceuticals’s adjusted operating margin declined by 51.5 percentage points over the last five years. This was the most relevant factor (aside from the revenue impact) behind its lower earnings; taxes and interest expenses can also affect EPS but don’t tell us as much about a company’s fundamentals.
In Q1, Vertex Pharmaceuticals reported EPS at $4.06, down from $4.76 in the same quarter last year. This print missed analysts’ estimates. Over the next 12 months, Wall Street is optimistic. Analysts forecast Vertex Pharmaceuticals’s full-year EPS of negative $0.41 will flip to positive $18.55.
Key Takeaways from Vertex Pharmaceuticals’s Q1 Results
We struggled to find many positives in these results as its revenue, EPS, and adjusted operating income fell short of Wall Street’s estimates. Overall, this quarter could have been better. The stock traded down 2.6% to $487 immediately after reporting.
Vertex Pharmaceuticals’s latest earnings report disappointed. One quarter doesn’t define a company’s quality, so let’s explore whether the stock is a buy at the current price. We think that the latest quarter is only one piece of the longer-term business quality puzzle. Quality, when combined with valuation, can help determine if the stock is a buy. We cover that in our actionable full research report which you can read here, it’s free.


