Industrial technology solutions provider EnPro Industries (NYSE: NPO) beat Wall Street’s revenue expectations in Q1 CY2025, with sales up 6.1% year on year to $273.2 million. On the other hand, the company’s full-year revenue guidance of $0.04 at the midpoint came in 100% below analysts’ estimates. Its non-GAAP profit of $1.90 per share was 14% above analysts’ consensus estimates.
Is now the time to buy Enpro? Find out by accessing our full research report, it’s free.
Enpro (NPO) Q1 CY2025 Highlights:
- Revenue: $273.2 million vs analyst estimates of $266.2 million (6.1% year-on-year growth, 2.6% beat)
- Adjusted EPS: $1.90 vs analyst estimates of $1.67 (14% beat)
- Adjusted EBITDA: $67.8 million vs analyst estimates of $61.97 million (24.8% margin, 9.4% beat)
- Management reiterated its full-year Adjusted EPS guidance of $7.35 at the midpoint
- EBITDA guidance for the full year is $269.5 million at the midpoint, above analyst estimates of $267.3 million
- Operating Margin: 15.3%, up from 12.7% in the same quarter last year
- Free Cash Flow was $11.6 million, up from -$1.9 million in the same quarter last year
- Market Capitalization: $3.28 billion
“Enpro's strong first quarter performance again highlights the resilience of the Enpro portfolio and reflects continued excellent execution amidst a dynamic macroeconomic backdrop,” said Eric Vaillancourt, President and Chief Executive Officer.
Company Overview
Holding a Guinness World Record for creating the world's largest gasket, Enpro (NYSE: NPO) designs, manufactures, and sells products used for machinery in various industries.
Sales Growth
Reviewing a company’s long-term sales performance reveals insights into its quality. Any business can have short-term success, but a top-tier one grows for years. Enpro’s demand was weak over the last five years as its sales fell at a 2.1% annual rate. This wasn’t a great result and suggests it’s a lower quality business.
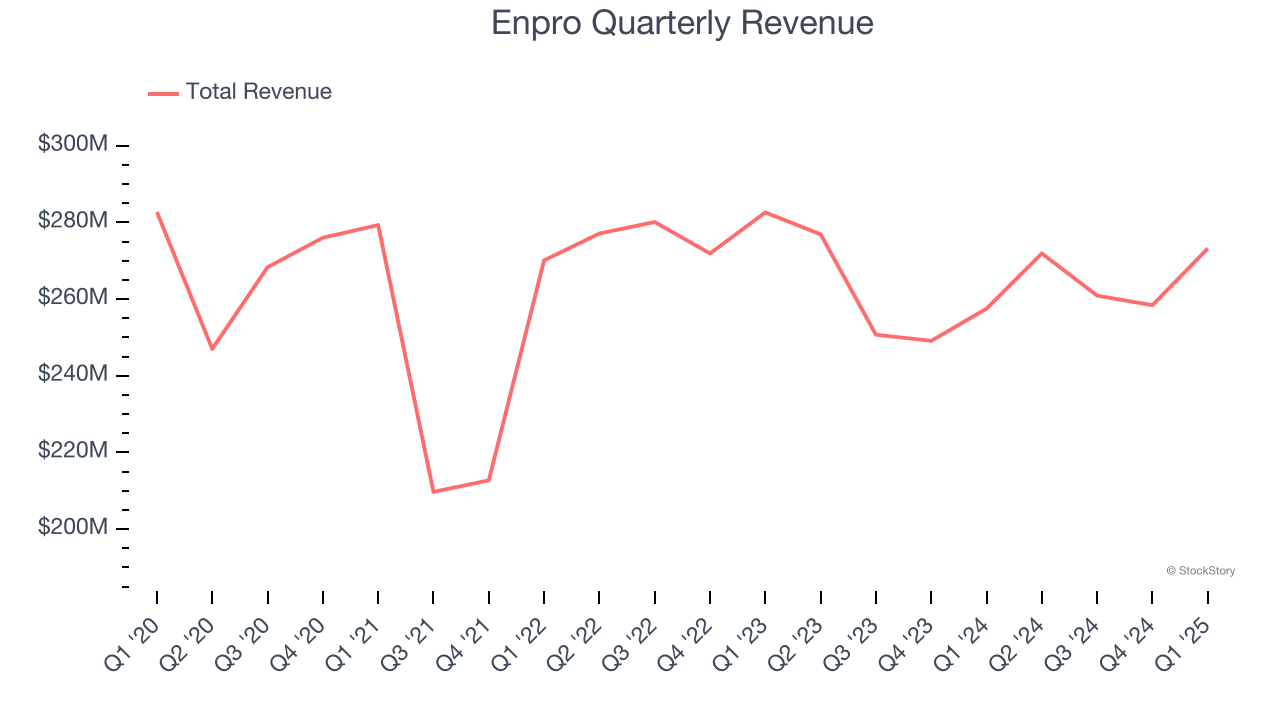
We at StockStory place the most emphasis on long-term growth, but within industrials, a half-decade historical view may miss cycles, industry trends, or a company capitalizing on catalysts such as a new contract win or a successful product line. Enpro’s annualized revenue declines of 2.2% over the last two years align with its five-year trend, suggesting its demand has consistently shrunk. 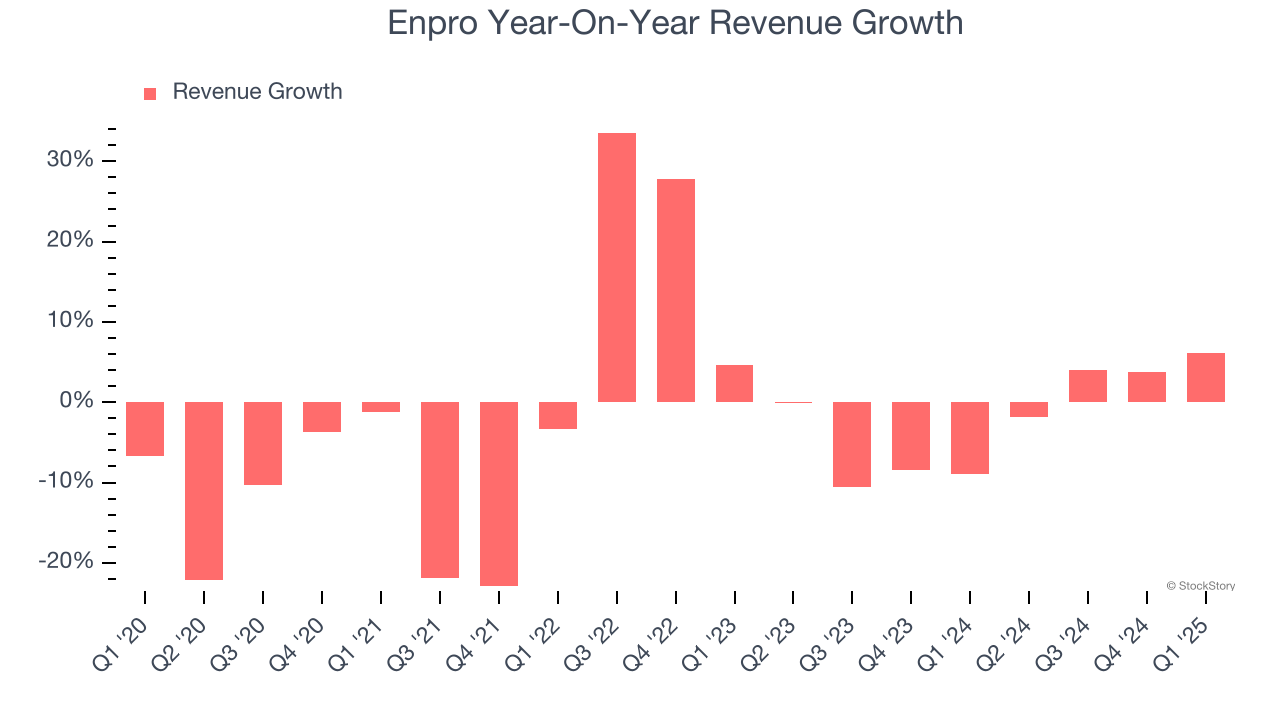
This quarter, Enpro reported year-on-year revenue growth of 6.1%, and its $273.2 million of revenue exceeded Wall Street’s estimates by 2.6%.
Looking ahead, sell-side analysts expect revenue to grow 3.9% over the next 12 months. While this projection suggests its newer products and services will catalyze better top-line performance, it is still below average for the sector.
Software is eating the world and there is virtually no industry left that has been untouched by it. That drives increasing demand for tools helping software developers do their jobs, whether it be monitoring critical cloud infrastructure, integrating audio and video functionality, or ensuring smooth content streaming. Click here to access a free report on our 3 favorite stocks to play this generational megatrend.
Operating Margin
Enpro has been an efficient company over the last five years. It was one of the more profitable businesses in the industrials sector, boasting an average operating margin of 12.2%. This result isn’t surprising as its high gross margin gives it a favorable starting point.
Looking at the trend in its profitability, Enpro’s operating margin rose by 8.2 percentage points over the last five years, showing its efficiency has meaningfully improved.
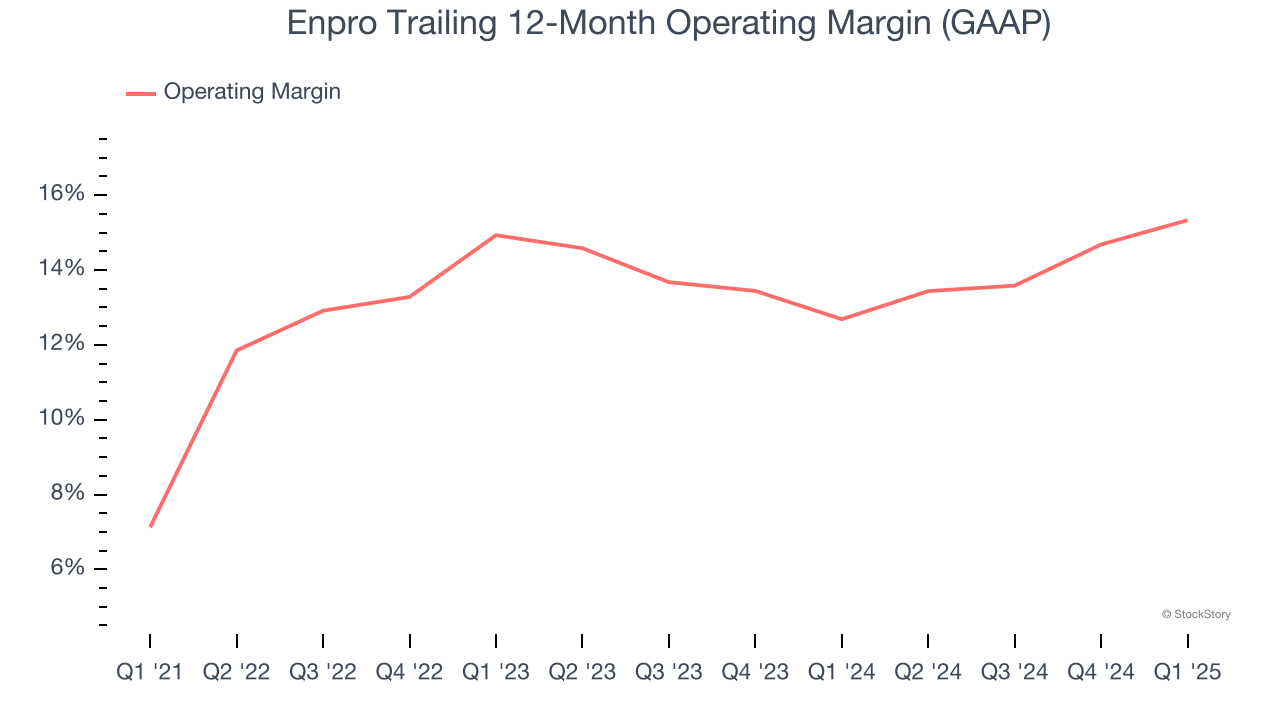
In Q1, Enpro generated an operating profit margin of 15.3%, up 2.6 percentage points year on year. The increase was encouraging, and because its operating margin rose more than its gross margin, we can infer it was more efficient with expenses such as marketing, R&D, and administrative overhead.
Earnings Per Share
Revenue trends explain a company’s historical growth, but the long-term change in earnings per share (EPS) points to the profitability of that growth – for example, a company could inflate its sales through excessive spending on advertising and promotions.
Enpro’s EPS grew at a spectacular 14.9% compounded annual growth rate over the last five years, higher than its 2.1% annualized revenue declines. This tells us management adapted its cost structure in response to a challenging demand environment.
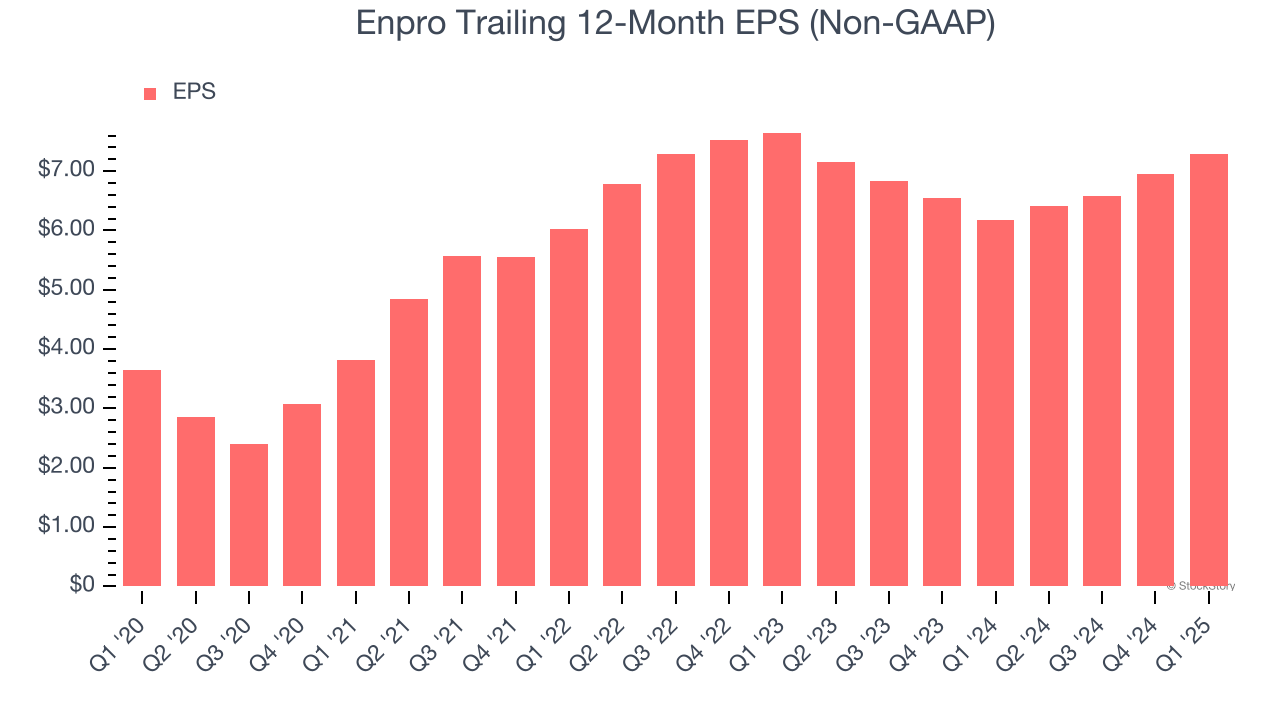
Diving into the nuances of Enpro’s earnings can give us a better understanding of its performance. As we mentioned earlier, Enpro’s operating margin expanded by 8.2 percentage points over the last five years. This was the most relevant factor (aside from the revenue impact) behind its higher earnings; taxes and interest expenses can also affect EPS but don’t tell us as much about a company’s fundamentals.
Like with revenue, we analyze EPS over a shorter period to see if we are missing a change in the business.
For Enpro, its two-year annual EPS declines of 2.4% mark a reversal from its (seemingly) healthy five-year trend. We hope Enpro can return to earnings growth in the future.
In Q1, Enpro reported EPS at $1.90, up from $1.57 in the same quarter last year. This print easily cleared analysts’ estimates, and shareholders should be content with the results. Over the next 12 months, Wall Street expects Enpro’s full-year EPS of $7.29 to grow 6.2%.
Key Takeaways from Enpro’s Q1 Results
We were impressed by how significantly Enpro blew past analysts’ EBITDA expectations this quarter. We were also glad its revenue outperformed Wall Street’s estimates. On the other hand, its full-year revenue guidance missed significantly. Overall, this print had some key positives. The stock traded up 2% to $158.35 immediately after reporting.
So should you invest in Enpro right now? We think that the latest quarter is only one piece of the longer-term business quality puzzle. Quality, when combined with valuation, can help determine if the stock is a buy. We cover that in our actionable full research report which you can read here, it’s free.