
Residential swimming pool manufacturer Latham (NASDAQ: SWIM) met Wall Street’s revenue expectations in Q1 CY2025, but sales were flat year on year at $111.4 million. The company’s full-year revenue guidance of $550 million at the midpoint came in 2.5% above analysts’ estimates. Its GAAP loss of $0.05 per share was 38.1% above analysts’ consensus estimates.
Is now the time to buy Latham? Find out by accessing our full research report, it’s free.
Latham (SWIM) Q1 CY2025 Highlights:
- "we remain cautious on 2025 new pool starts, which we currently project to be roughly in line with 2024 levels. Additionally, we are closely monitoring the impact of elevated tariffs on imported raw materials. Imports represent approximately 15-20% of the raw materials used in our manufacturing process"
- Revenue: $111.4 million vs analyst estimates of $111.3 million (flat year on year, in line)
- EPS (GAAP): -$0.05 vs analyst estimates of -$0.08 (38.1% beat)
- Adjusted EBITDA: $11.1 million vs analyst estimates of $10.94 million (10% margin, 1.4% beat)
- The company reconfirmed its revenue guidance for the full year of $550 million at the midpoint
- EBITDA guidance for the full year is $95 million at the midpoint, above analyst estimates of $90.47 million
- Operating Margin: -4.4%, down from -1.9% in the same quarter last year
- Free Cash Flow was -$50.33 million compared to -$39.86 million in the same quarter last year
- Market Capitalization: $702.8 million
Commenting on the results, Scott Rajeski, President and CEO, said, “Our first quarter results were in line with our expectations and reflected the relative strength of Latham’s fiberglass pool and autocover product categories and the ongoing benefits from our lean manufacturing and value engineering initiatives.
Company Overview
Started as a family business, Latham (NASDAQ: SWIM) is a global designer and manufacturer of in-ground residential swimming pools and related products.
Sales Growth
A company’s long-term sales performance can indicate its overall quality. Any business can put up a good quarter or two, but many enduring ones grow for years. Unfortunately, Latham struggled to consistently increase demand as its $509.3 million of sales for the trailing 12 months was close to its revenue four years ago. This was below our standards and suggests it’s a low quality business.
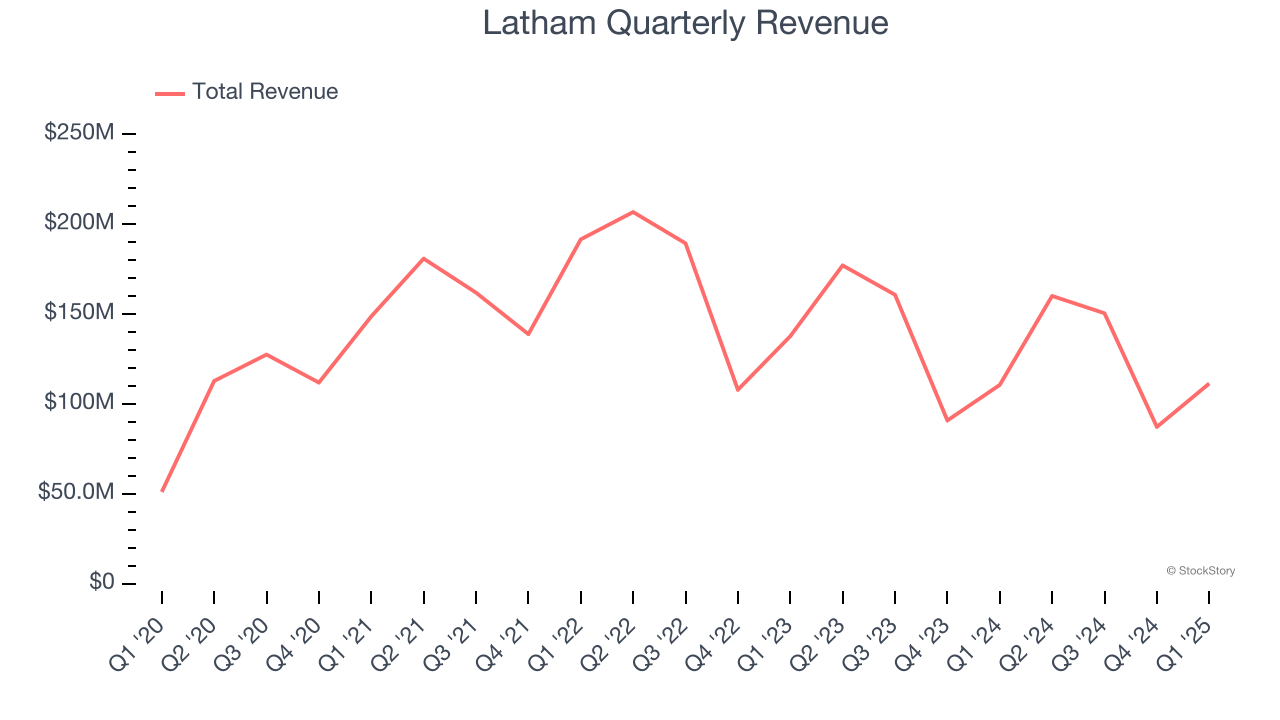
Long-term growth is the most important, but within consumer discretionary, product cycles are short and revenue can be hit-driven due to rapidly changing trends and consumer preferences. Latham’s recent performance shows its demand remained suppressed as its revenue has declined by 10.9% annually over the last two years. 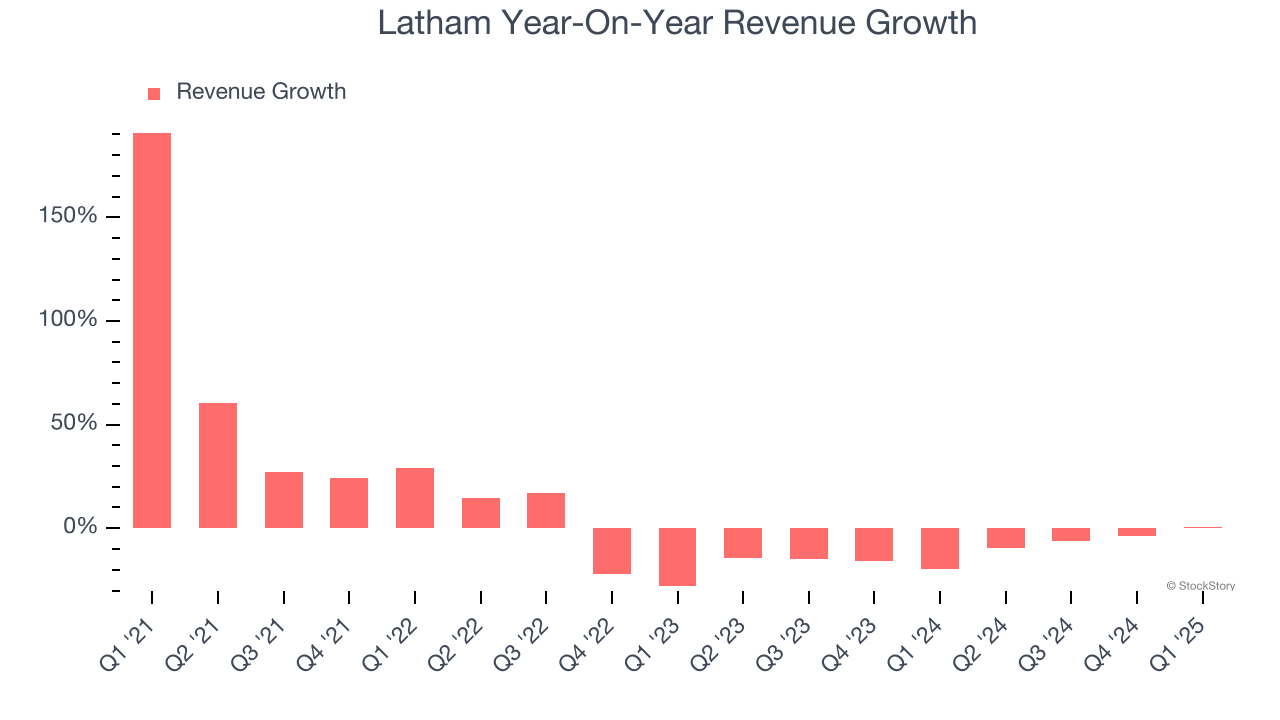
This quarter, Latham’s $111.4 million of revenue was flat year on year and in line with Wall Street’s estimates.
Looking ahead, sell-side analysts expect revenue to grow 5.4% over the next 12 months. While this projection suggests its newer products and services will spur better top-line performance, it is still below the sector average.
Here at StockStory, we certainly understand the potential of thematic investing. Diverse winners from Microsoft (MSFT) to Alphabet (GOOG), Coca-Cola (KO) to Monster Beverage (MNST) could all have been identified as promising growth stories with a megatrend driving the growth. So, in that spirit, we’ve identified a relatively under-the-radar profitable growth stock benefiting from the rise of AI, available to you FREE via this link.
Operating Margin
Operating margin is an important measure of profitability as it shows the portion of revenue left after accounting for all core expenses – everything from the cost of goods sold to advertising and wages. It’s also useful for comparing profitability across companies with different levels of debt and tax rates because it excludes interest and taxes.
Latham’s operating margin might fluctuated slightly over the last 12 months but has generally stayed the same, averaging 3.4% over the last two years. This profitability was lousy for a consumer discretionary business and caused by its suboptimal cost structure.
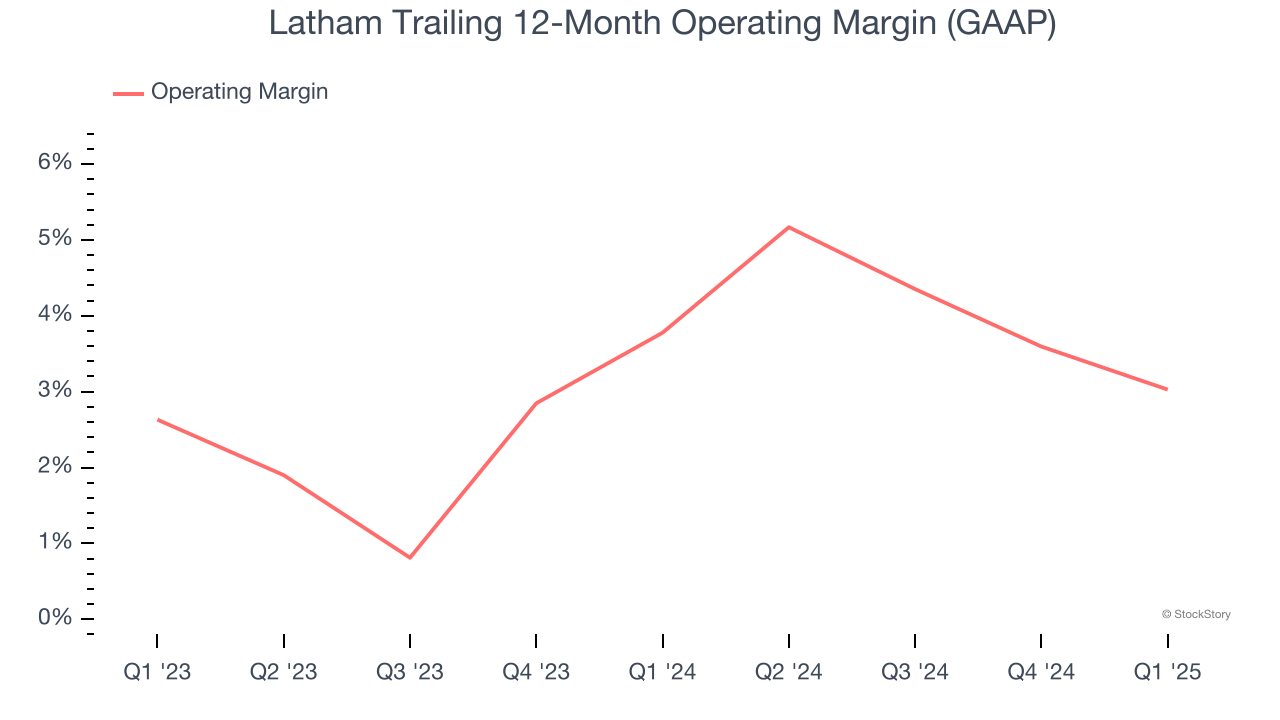
In Q1, Latham generated an operating profit margin of negative 4.4%, down 2.6 percentage points year on year. This contraction shows it was less efficient because its expenses increased relative to its revenue.
Earnings Per Share
Revenue trends explain a company’s historical growth, but the long-term change in earnings per share (EPS) points to the profitability of that growth – for example, a company could inflate its sales through excessive spending on advertising and promotions.
Sadly for Latham, its EPS declined by 23.6% annually over the last four years while its revenue was flat. This tells us the company struggled because its fixed cost base made it difficult to adjust to choppy demand.
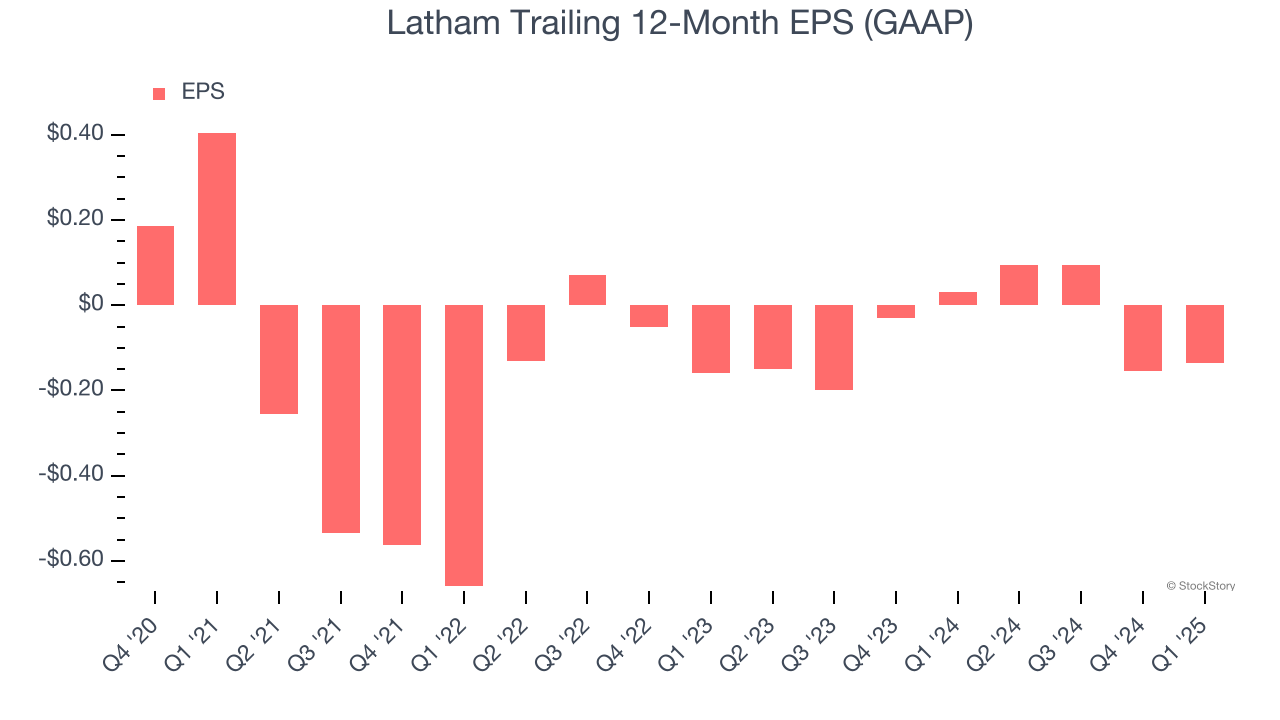
In Q1, Latham reported EPS at negative $0.05, up from negative $0.07 in the same quarter last year. This print easily cleared analysts’ estimates, and shareholders should be content with the results. Over the next 12 months, Wall Street is optimistic. Analysts forecast Latham’s full-year EPS of negative $0.14 will reach break even.
Key Takeaways from Latham’s Q1 Results
The results were good but management's cautious commentary about demand and about tariffs added uncertainty. Shares traded down 5.1% to $5.67 immediately following the results.
Is Latham an attractive investment opportunity at the current price? We think that the latest quarter is only one piece of the longer-term business quality puzzle. Quality, when combined with valuation, can help determine if the stock is a buy. We cover that in our actionable full research report which you can read here, it’s free.


