
Cruise and exploration company Lindblad Expeditions (NASDAQ: LIND) announced better-than-expected revenue in Q1 CY2025, with sales up 17% year on year to $179.7 million. The company’s full-year revenue guidance of $725 million at the midpoint came in 2.1% above analysts’ estimates. Its GAAP loss of $0 per share was significantly above analysts’ consensus estimates.
Is now the time to buy Lindblad Expeditions? Find out by accessing our full research report, it’s free.
Lindblad Expeditions (LIND) Q1 CY2025 Highlights:
- Revenue: $179.7 million vs analyst estimates of $151.3 million (17% year-on-year growth, 18.8% beat)
- EPS (GAAP): $0 vs analyst estimates of -$0.14 (significant beat)
- Adjusted EBITDA: $29.98 million vs analyst estimates of $19.28 million (16.7% margin, 55.5% beat)
- The company reconfirmed its revenue guidance for the full year of $725 million at the midpoint
- EBITDA guidance for the full year is $106 million at the midpoint, in line with analyst expectations
- Operating Margin: 5.9%, in line with the same quarter last year
- Free Cash Flow Margin: 19.5%, down from 24.4% in the same quarter last year
- Market Capitalization: $497.8 million
Natalya Leahy, Chief Executive Officer, said "We delivered outstanding results in Q1, and I couldn't be more proud of our team. With 89% occupancy and a historically high yield of $1,521 we've set a powerful tone for the year ahead.
Company Overview
Founded by explorer Sven-Olof Lindblad in 1979, Lindblad Expeditions (NASDAQ: LIND) offers cruising experiences to remote destinations in partnership with National Geographic.
Sales Growth
A company’s long-term sales performance can indicate its overall quality. Even a bad business can shine for one or two quarters, but a top-tier one grows for years. Over the last five years, Lindblad Expeditions grew its sales at a 14.9% compounded annual growth rate. Although this growth is acceptable on an absolute basis, it fell short of our standards for the consumer discretionary sector, which enjoys a number of secular tailwinds.
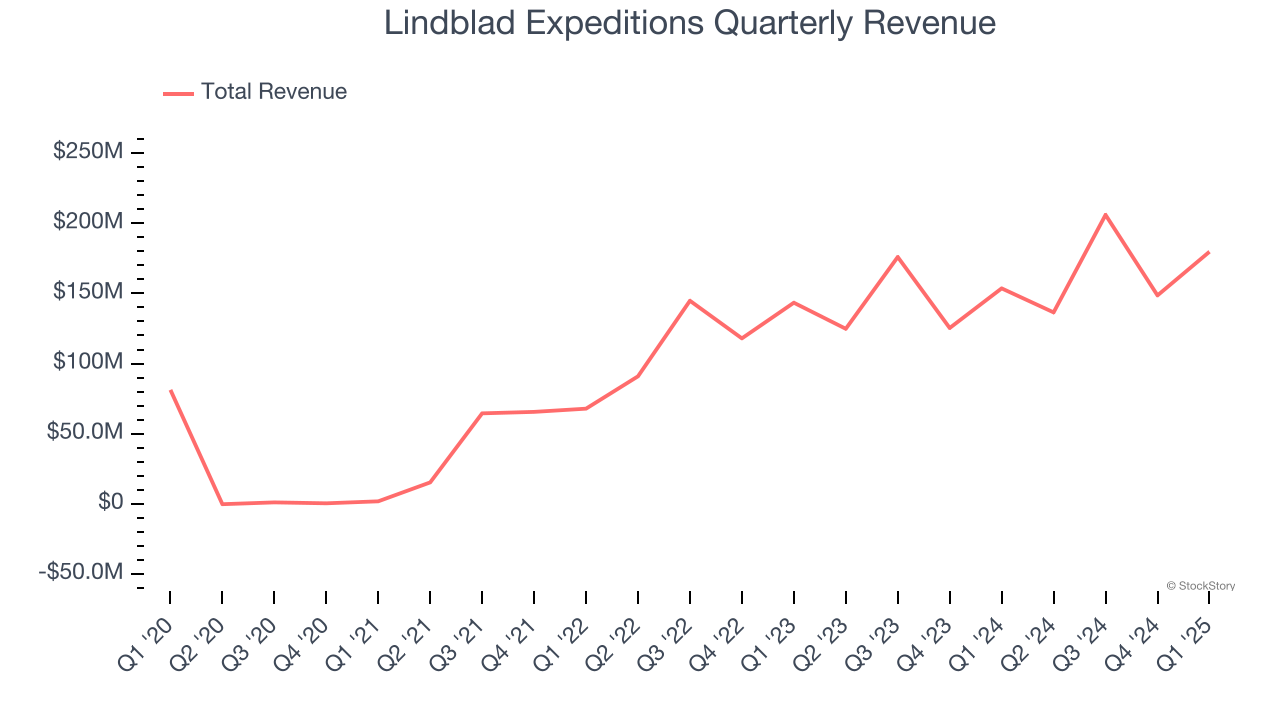
We at StockStory place the most emphasis on long-term growth, but within consumer discretionary, a stretched historical view may miss a company riding a successful new property or trend. Lindblad Expeditions’s annualized revenue growth of 16.2% over the last two years is above its five-year trend, suggesting some bright spots. 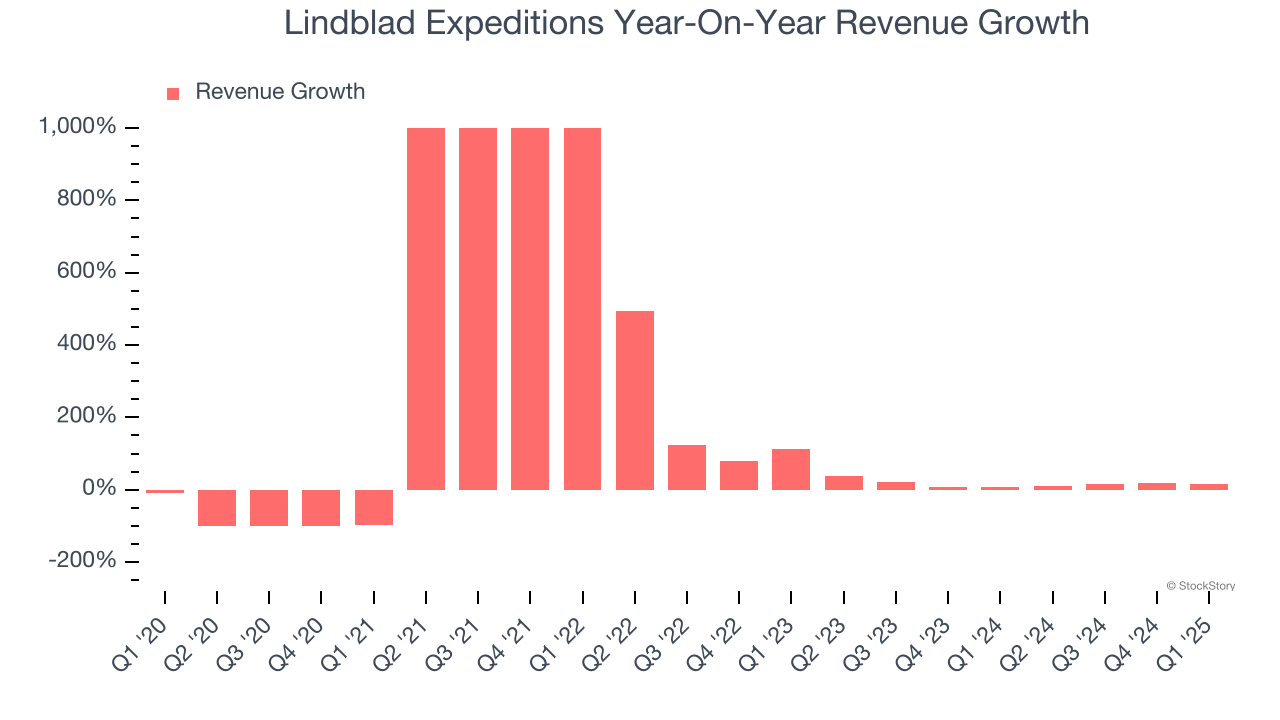
This quarter, Lindblad Expeditions reported year-on-year revenue growth of 17%, and its $179.7 million of revenue exceeded Wall Street’s estimates by 18.8%.
Looking ahead, sell-side analysts expect revenue to grow 9.5% over the next 12 months, a deceleration versus the last two years. This projection doesn't excite us and implies its products and services will face some demand challenges.
Software is eating the world and there is virtually no industry left that has been untouched by it. That drives increasing demand for tools helping software developers do their jobs, whether it be monitoring critical cloud infrastructure, integrating audio and video functionality, or ensuring smooth content streaming. Click here to access a free report on our 3 favorite stocks to play this generational megatrend.
Operating Margin
Lindblad Expeditions’s operating margin has been trending up over the last 12 months and averaged 2.9% over the last two years. The company’s higher efficiency is a breath of fresh air, but its suboptimal cost structure means it still sports lousy profitability for a consumer discretionary business.
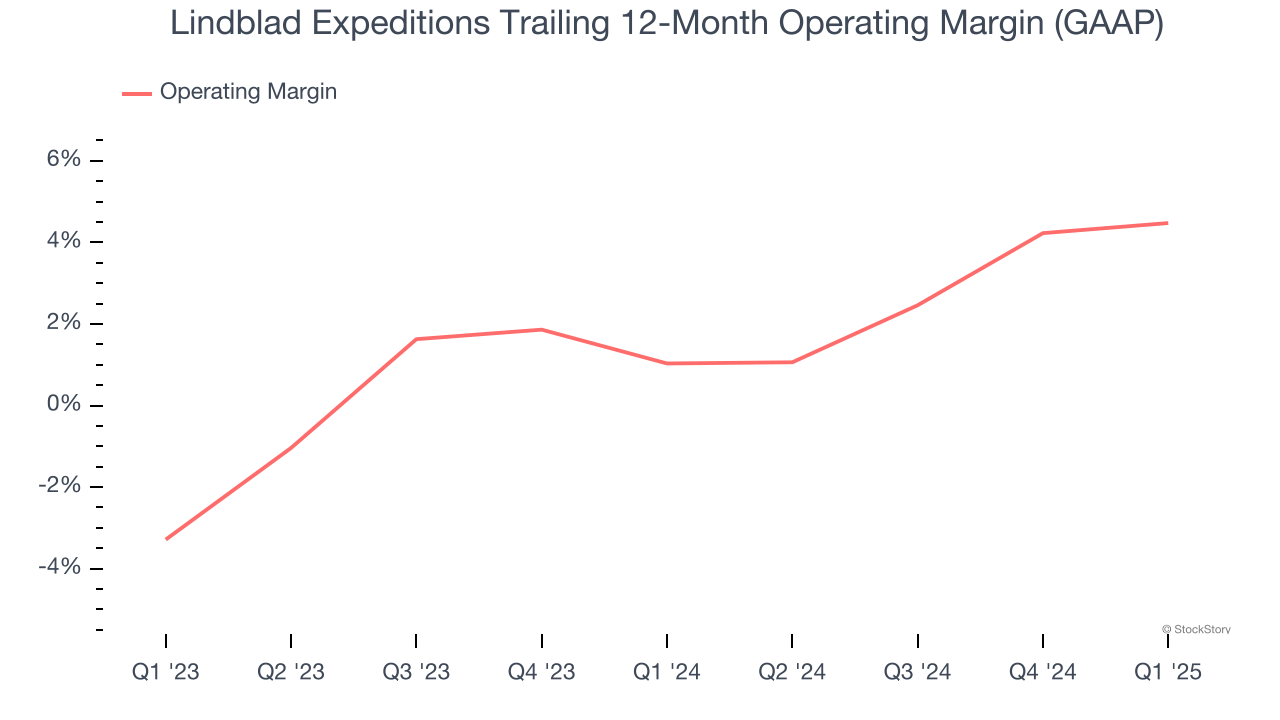
This quarter, Lindblad Expeditions generated an operating profit margin of 5.9%, in line with the same quarter last year. This indicates the company’s overall cost structure has been relatively stable.
Earnings Per Share
Revenue trends explain a company’s historical growth, but the long-term change in earnings per share (EPS) points to the profitability of that growth – for example, a company could inflate its sales through excessive spending on advertising and promotions.
Lindblad Expeditions’s earnings losses deepened over the last five years as its EPS dropped 153% annually. However, it’s bucked its trend as of late, increasing its EPS over the last three years. We’ll see if it can maintain its growth.
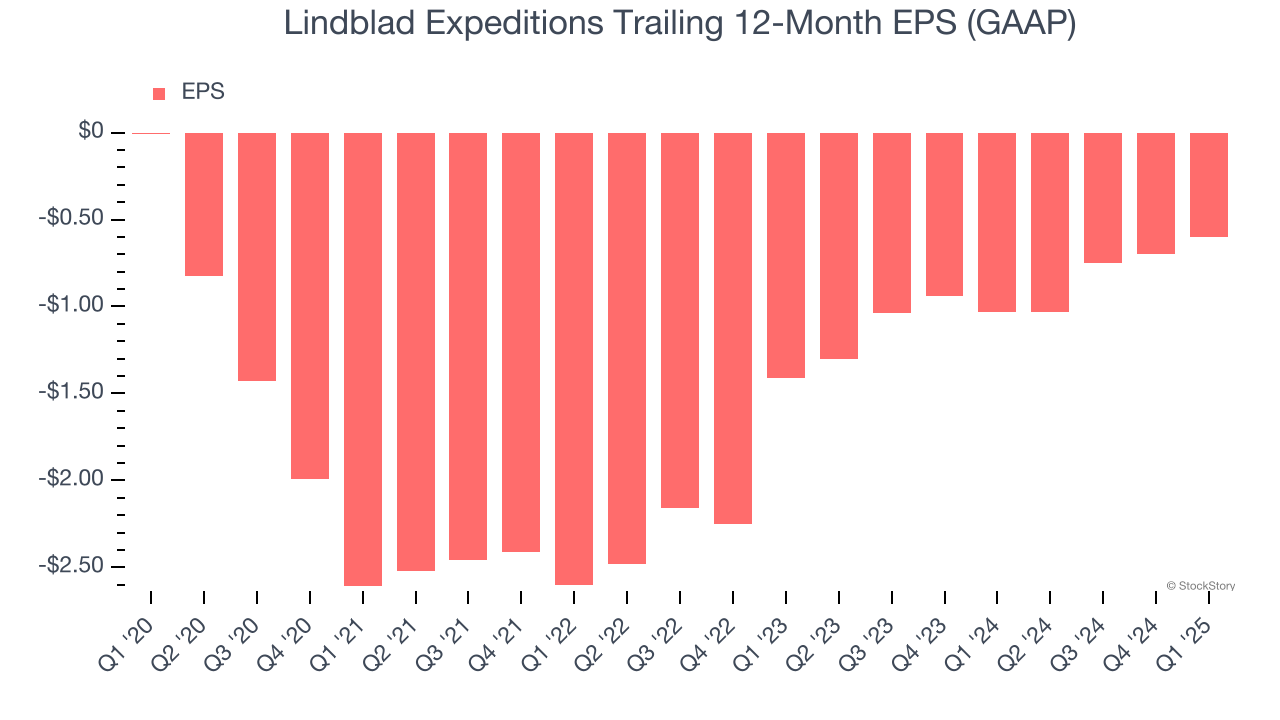
In Q1, Lindblad Expeditions reported EPS at $0, up from negative $0.10 in the same quarter last year. This print easily cleared analysts’ estimates, and shareholders should be content with the results. Over the next 12 months, Wall Street is optimistic. Analysts forecast Lindblad Expeditions’s full-year EPS of negative $0.60 will reach break even.
Key Takeaways from Lindblad Expeditions’s Q1 Results
We were impressed by how significantly Lindblad Expeditions blew past analysts’ EPS expectations this quarter. We were also excited its EBITDA outperformed Wall Street’s estimates by a wide margin. Zooming out, we think this was a good print with some key areas of upside. The stock remained flat at $9.12 immediately following the results.
Lindblad Expeditions had an encouraging quarter, but one earnings result doesn’t necessarily make the stock a buy. Let’s see if this is a good investment. What happened in the latest quarter matters, but not as much as longer-term business quality and valuation, when deciding whether to invest in this stock. We cover that in our actionable full research report which you can read here, it’s free.