Vertically integrated manufacturing solutions provider Mayville Engineering Company (NYSE: MEC) beat Wall Street’s revenue expectations in Q1 CY2025, but sales fell by 15.9% year on year to $135.6 million. The company’s full-year revenue guidance of $575 million at the midpoint came in 0.7% above analysts’ estimates. Its non-GAAP profit of $0.04 per share was $0.02 above analysts’ consensus estimates.
Is now the time to buy Mayville Engineering? Find out by accessing our full research report, it’s free.
Mayville Engineering (MEC) Q1 CY2025 Highlights:
- Revenue: $135.6 million vs analyst estimates of $134.5 million (15.9% year-on-year decline, 0.8% beat)
- Adjusted EPS: $0.04 vs analyst estimates of $0.02 ($0.02 beat)
- Adjusted EBITDA: $12.16 million vs analyst estimates of $11.66 million (9% margin, 4.3% beat)
- The company reconfirmed its revenue guidance for the full year of $575 million at the midpoint
- EBITDA guidance for the full year is $63 million at the midpoint, above analyst estimates of $59.25 million
- Operating Margin: 1.2%, down from 4.7% in the same quarter last year
- Free Cash Flow Margin: 4%, similar to the same quarter last year
- Market Capitalization: $269.7 million
Company Overview
Originally founded solely on tool and die manufacturing, Mayville Engineering Company (NYSE: MEC) specializes in metal fabrication, tube bending, and welding to be used in various industries.
Sales Growth
A company’s long-term sales performance is one signal of its overall quality. Any business can have short-term success, but a top-tier one grows for years. Unfortunately, Mayville Engineering’s 2.8% annualized revenue growth over the last five years was sluggish. This fell short of our benchmarks and is a poor baseline for our analysis.
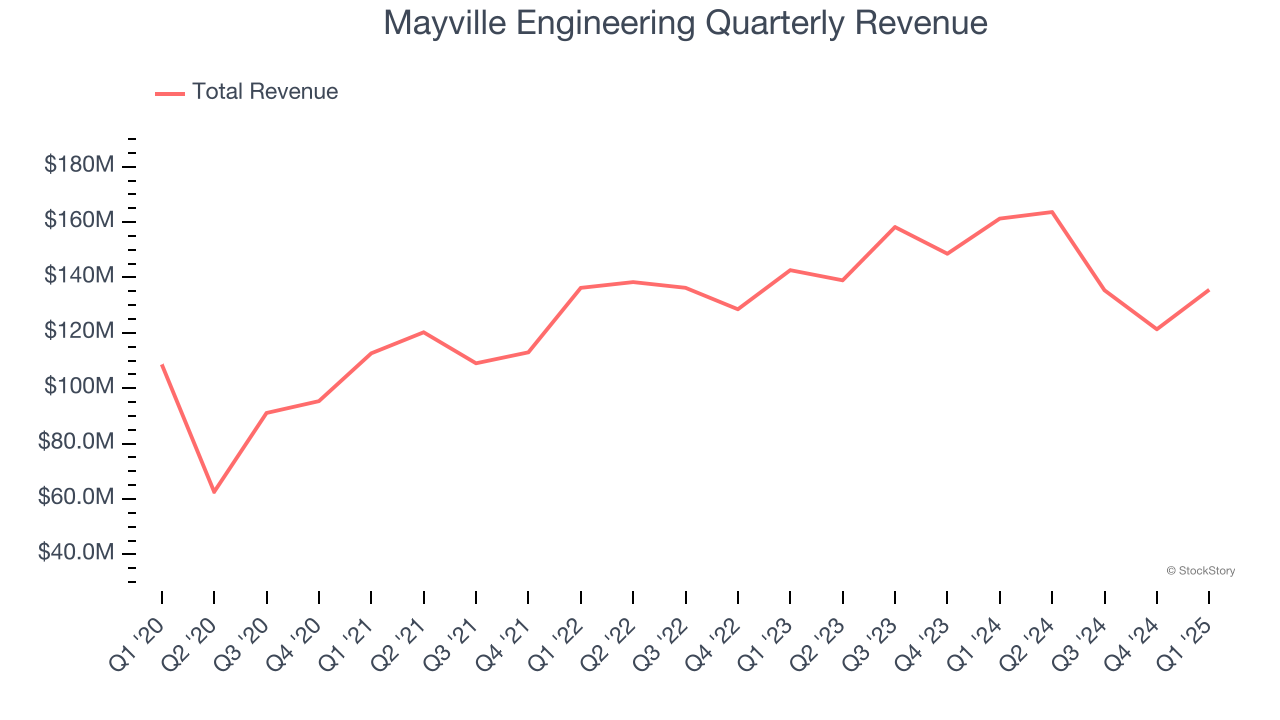
Long-term growth is the most important, but within industrials, a half-decade historical view may miss new industry trends or demand cycles. Mayville Engineering’s recent performance shows its demand has slowed as its revenue was flat over the last two years. 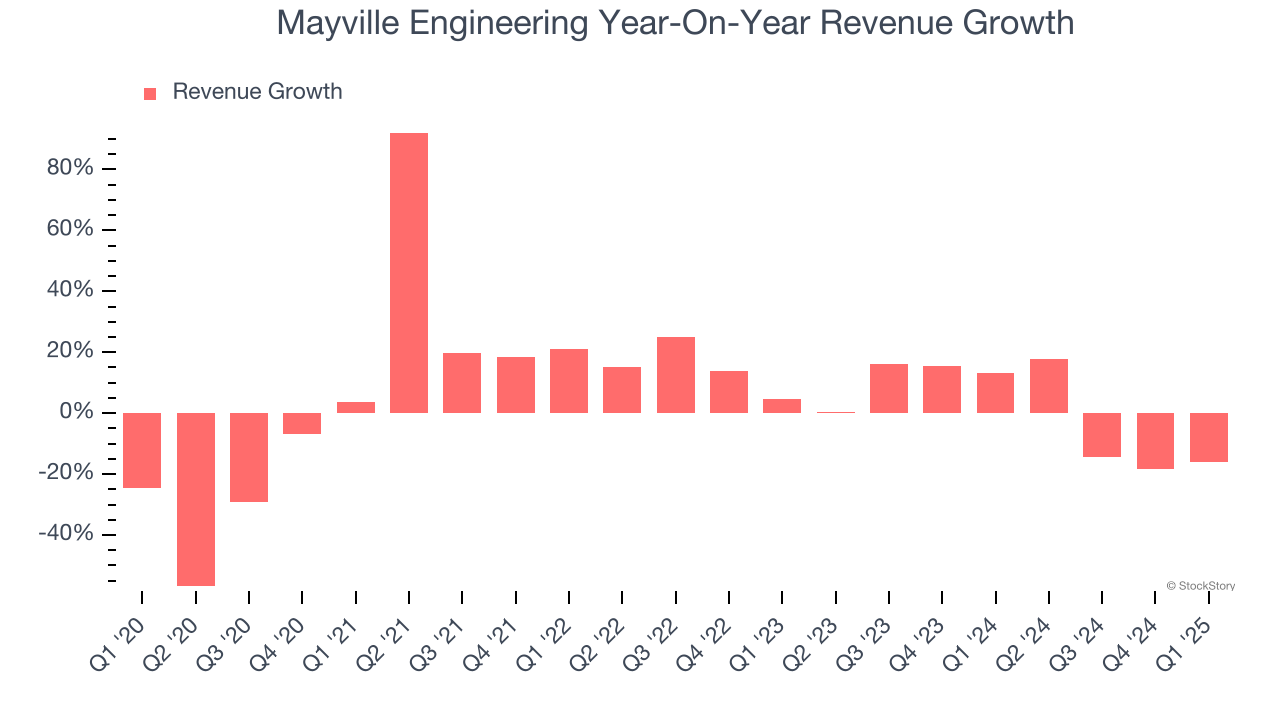
We can better understand the company’s revenue dynamics by analyzing its most important segments, Commercial Vehicle and Construction & Access, which are 37.5% and 14.4% of revenue. Over the last two years, Mayville Engineering’s Commercial Vehicle revenue (exhaust, engine components, fuel systems) averaged 2% year-on-year declines while its Construction & Access revenue (fenders, hoods, frames for heavy machinery) averaged 11.2% declines.
This quarter, Mayville Engineering’s revenue fell by 15.9% year on year to $135.6 million but beat Wall Street’s estimates by 0.8%.
Looking ahead, sell-side analysts expect revenue to grow 6.9% over the next 12 months. While this projection suggests its newer products and services will fuel better top-line performance, it is still below average for the sector.
Here at StockStory, we certainly understand the potential of thematic investing. Diverse winners from Microsoft (MSFT) to Alphabet (GOOG), Coca-Cola (KO) to Monster Beverage (MNST) could all have been identified as promising growth stories with a megatrend driving the growth. So, in that spirit, we’ve identified a relatively under-the-radar profitable growth stock benefiting from the rise of AI, available to you FREE via this link.
Operating Margin
Mayville Engineering was profitable over the last five years but held back by its large cost base. Its average operating margin of 3% was weak for an industrials business. This result isn’t too surprising given its low gross margin as a starting point.
On the plus side, Mayville Engineering’s operating margin rose by 8 percentage points over the last five years, as its sales growth gave it operating leverage.
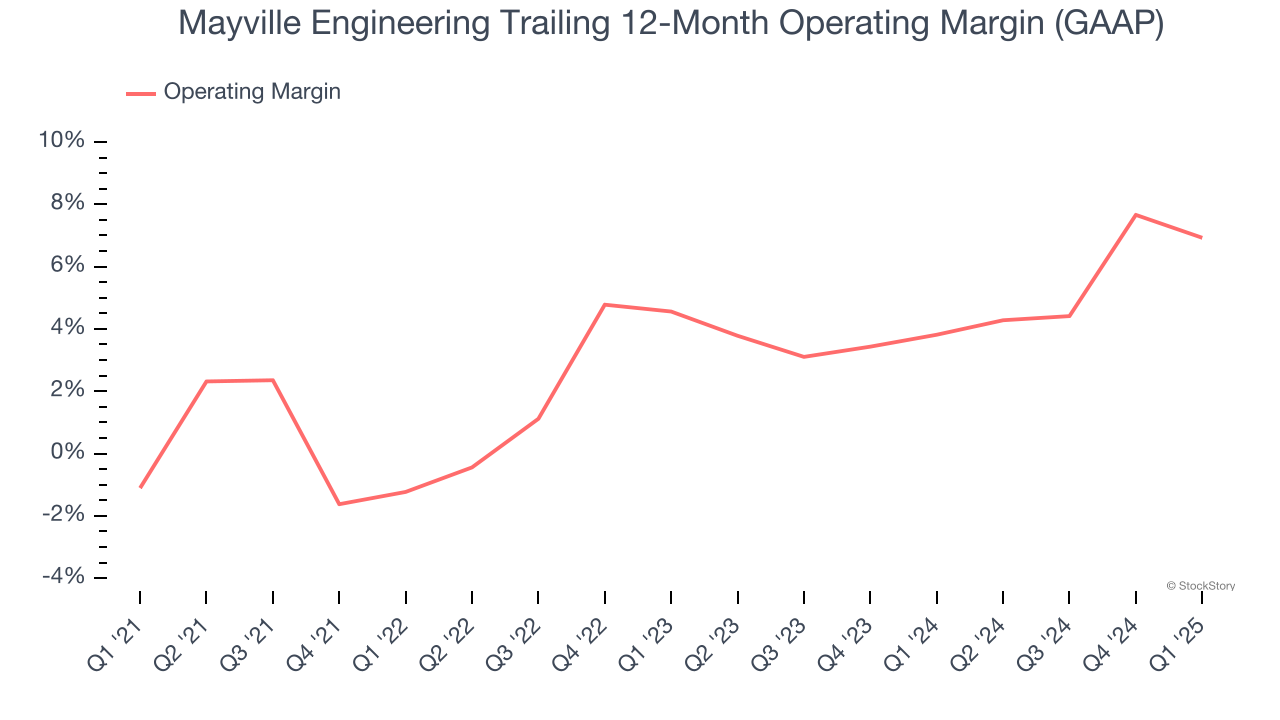
This quarter, Mayville Engineering generated an operating profit margin of 1.2%, down 3.6 percentage points year on year. Since Mayville Engineering’s operating margin decreased more than its gross margin, we can assume it was less efficient because expenses such as marketing, R&D, and administrative overhead increased.
Earnings Per Share
We track the long-term change in earnings per share (EPS) for the same reason as long-term revenue growth. Compared to revenue, however, EPS highlights whether a company’s growth is profitable.
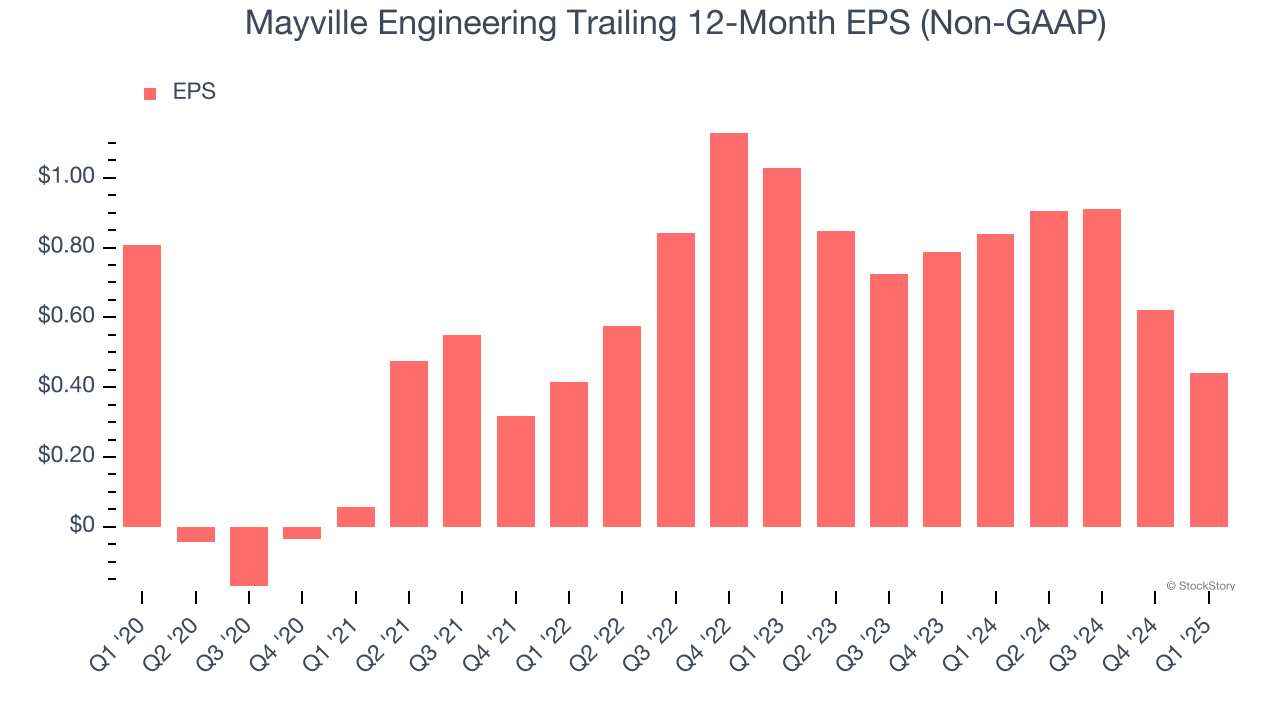
Sadly for Mayville Engineering, its EPS declined by 11.4% annually over the last five years while its revenue grew by 2.8%. However, its operating margin actually expanded during this time, telling us that non-fundamental factors such as interest expenses and taxes affected its ultimate earnings.
We can take a deeper look into Mayville Engineering’s earnings to better understand the drivers of its performance. A five-year view shows Mayville Engineering has diluted its shareholders, growing its share count by 6.2%. This dilution overshadowed its increased operating efficiency and has led to lower per share earnings. Taxes and interest expenses can also affect EPS but don’t tell us as much about a company’s fundamentals. 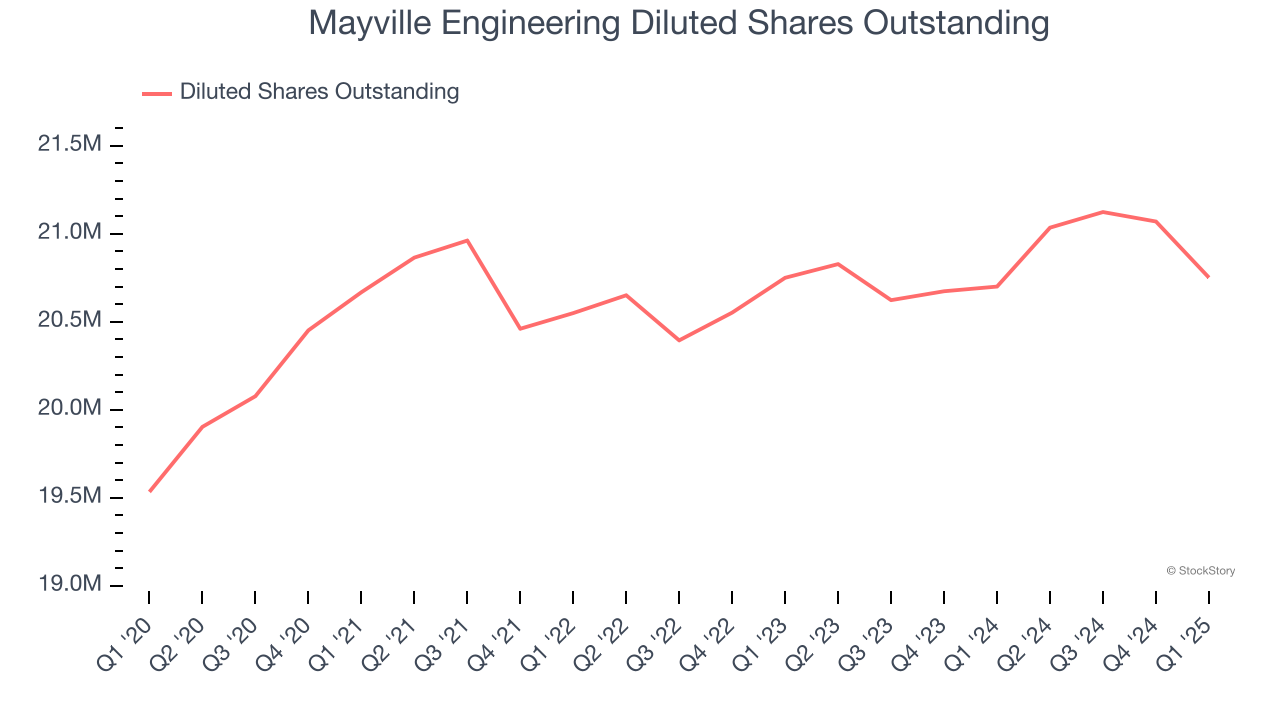
Like with revenue, we analyze EPS over a more recent period because it can provide insight into an emerging theme or development for the business.
For Mayville Engineering, its two-year annual EPS declines of 34.6% show it’s continued to underperform. These results were bad no matter how you slice the data.
In Q1, Mayville Engineering reported EPS at $0.04, down from $0.22 in the same quarter last year. Despite falling year on year, this print easily cleared analysts’ estimates. We also like to analyze expected EPS growth based on Wall Street analysts’ consensus projections, but there is insufficient data.
Key Takeaways from Mayville Engineering’s Q1 Results
We were impressed by how significantly Mayville Engineering blew past analysts’ EPS expectations this quarter. We were also glad its full-year EBITDA guidance trumped Wall Street’s estimates. On the other hand, its Commercial Vehicle revenue missed. Zooming out, we think this quarter featured some important positives. The stock traded up 3.5% to $13.71 immediately after reporting.
Sure, Mayville Engineering had a solid quarter, but if we look at the bigger picture, is this stock a buy? The latest quarter does matter, but not nearly as much as longer-term fundamentals and valuation, when deciding if the stock is a buy. We cover that in our actionable full research report which you can read here, it’s free.