
Genetic testing company Myriad Genetics (NASDAQ: MYGN) missed Wall Street’s revenue expectations in Q1 CY2025, with sales falling 3.1% year on year to $195.9 million. The company’s full-year revenue guidance of $815 million at the midpoint came in 3.7% below analysts’ estimates. Its non-GAAP loss of $0.03 per share was $0.02 above analysts’ consensus estimates.
Is now the time to buy Myriad Genetics? Find out by accessing our full research report, it’s free.
Myriad Genetics (MYGN) Q1 CY2025 Highlights:
- Revenue: $195.9 million vs analyst estimates of $200.4 million (3.1% year-on-year decline, 2.3% miss)
- Adjusted EPS: -$0.03 vs analyst estimates of -$0.05 ($0.02 beat)
- Adjusted EBITDA: -$100,000 vs analyst estimates of -$1.92 million (-0.1% margin, 94.8% beat)
- The company dropped its revenue guidance for the full year to $815 million at the midpoint from $850 million, a 4.1% decrease
- Adjusted EPS guidance for Q2 CY2025 is $0 at the midpoint, below analyst estimates of $0.02
- EBITDA guidance for the full year is $23 million at the midpoint, below analyst estimates of $29.85 million
- Operating Margin: -14.8%, down from -13.8% in the same quarter last year
- Free Cash Flow was -$18.7 million compared to -$25.3 million in the same quarter last year
- Market Capitalization: $709.7 million
“We had a challenging first quarter of 2025 with strength in our prenatal and oncology MyRisk tests offset by softness in GeneSight and unaffected hereditary cancer tests. While we are actively working on initiatives to re-accelerate testing volumes, this will take time; therefore we are lowering our 2025 financial guidance. We are taking immediate steps to reduce overall expenditures while prioritizing investment in new product development and programs intended to drive revenue growth,” said Sam Raha, President and CEO, of Myriad Genetics.
Company Overview
Founded in 1991 as one of the pioneers in translating genetic discoveries into clinical applications, Myriad Genetics (NASDAQ: MYGN) develops genetic tests that assess disease risk, guide treatment decisions, and provide insights across oncology, women's health, and mental health.
Sales Growth
Reviewing a company’s long-term sales performance reveals insights into its quality. Any business can have short-term success, but a top-tier one grows for years. Unfortunately, Myriad Genetics’s 1.8% annualized revenue growth over the last five years was tepid. This was below our standards and is a tough starting point for our analysis.
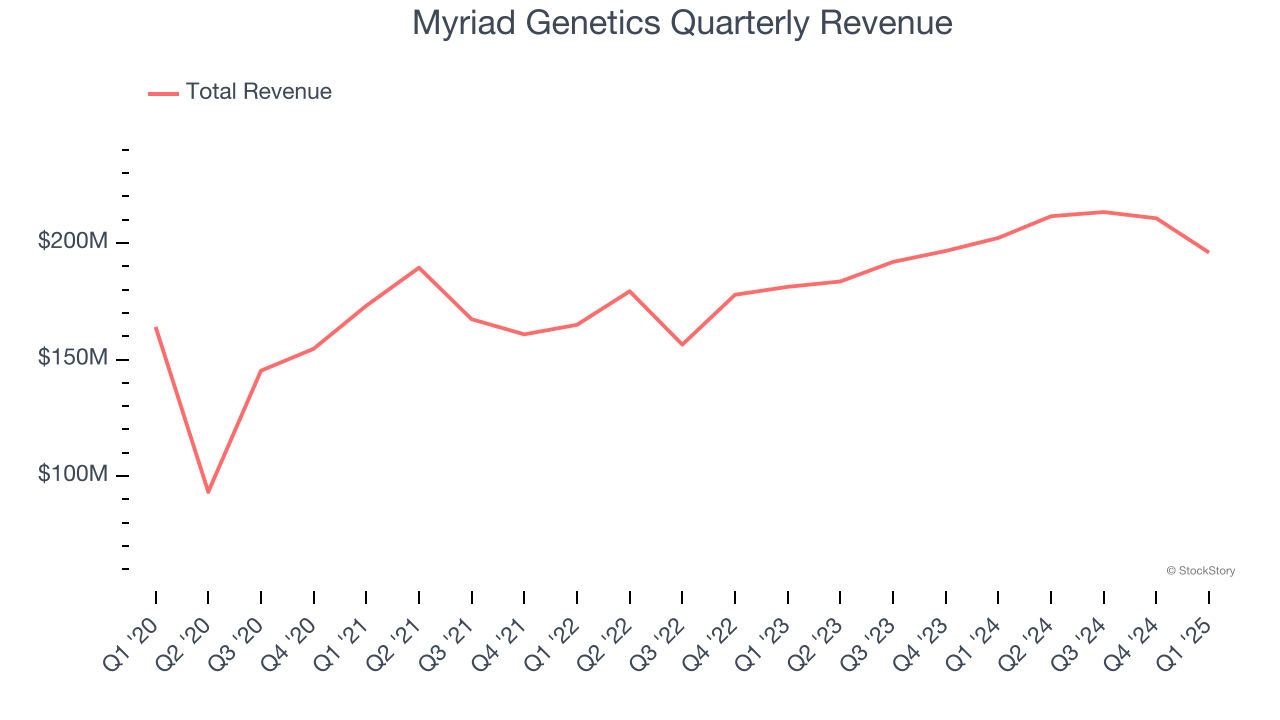
We at StockStory place the most emphasis on long-term growth, but within healthcare, a half-decade historical view may miss recent innovations or disruptive industry trends. Myriad Genetics’s annualized revenue growth of 9.4% over the last two years is above its five-year trend, suggesting some bright spots. 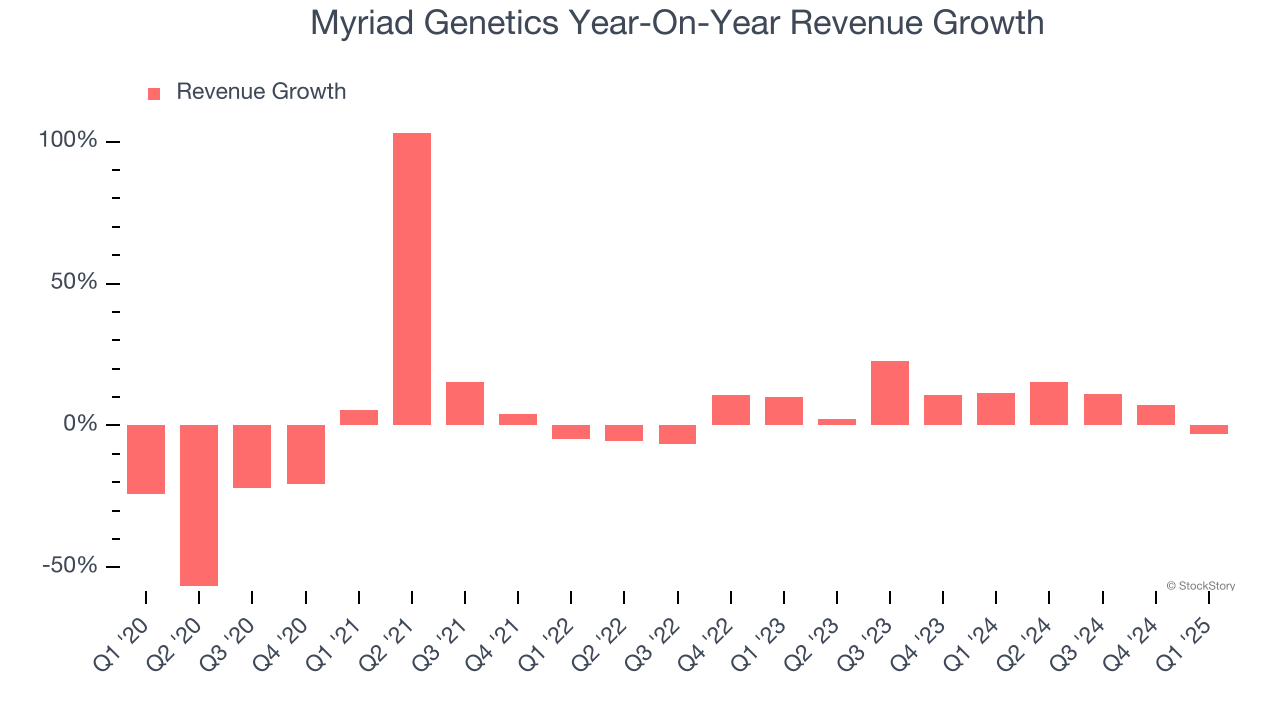
This quarter, Myriad Genetics missed Wall Street’s estimates and reported a rather uninspiring 3.1% year-on-year revenue decline, generating $195.9 million of revenue.
Looking ahead, sell-side analysts expect revenue to grow 4% over the next 12 months, a deceleration versus the last two years. This projection doesn't excite us and implies its products and services will face some demand challenges.
Software is eating the world and there is virtually no industry left that has been untouched by it. That drives increasing demand for tools helping software developers do their jobs, whether it be monitoring critical cloud infrastructure, integrating audio and video functionality, or ensuring smooth content streaming. Click here to access a free report on our 3 favorite stocks to play this generational megatrend.
Adjusted Operating Margin
Adjusted operating margin is one of the best measures of profitability because it tells us how much money a company takes home after subtracting all core expenses, like marketing and R&D. It also removes various one-time costs to paint a better picture of normalized profits.
Myriad Genetics’s high expenses have contributed to an average adjusted operating margin of negative 2.8% over the last five years. Unprofitable healthcare companies require extra attention because they could get caught swimming naked when the tide goes out. It’s hard to trust that the business can endure a full cycle.
On the plus side, Myriad Genetics’s adjusted operating margin rose by 14.2 percentage points over the last five years, as its sales growth gave it operating leverage. Zooming in on its more recent performance, we can see the company’s trajectory is intact as its margin has also increased by 9.5 percentage points on a two-year basis.
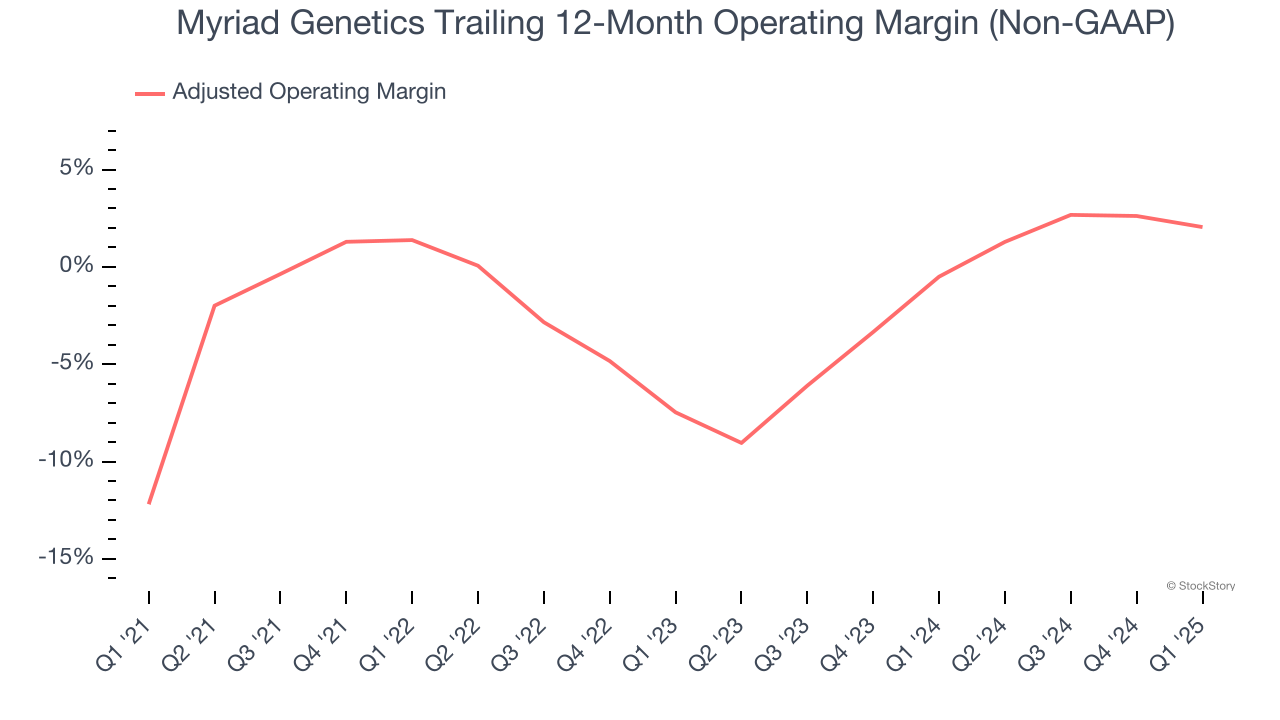
This quarter, Myriad Genetics generated a negative 2.8% adjusted operating margin. The company's consistent lack of profits raise a flag.
Earnings Per Share
We track the long-term change in earnings per share (EPS) for the same reason as long-term revenue growth. Compared to revenue, however, EPS highlights whether a company’s growth is profitable.
Sadly for Myriad Genetics, its EPS declined by 29.1% annually over the last five years while its revenue grew by 1.8%. However, its adjusted operating margin actually expanded during this time, telling us that non-fundamental factors such as interest expenses and taxes affected its ultimate earnings.
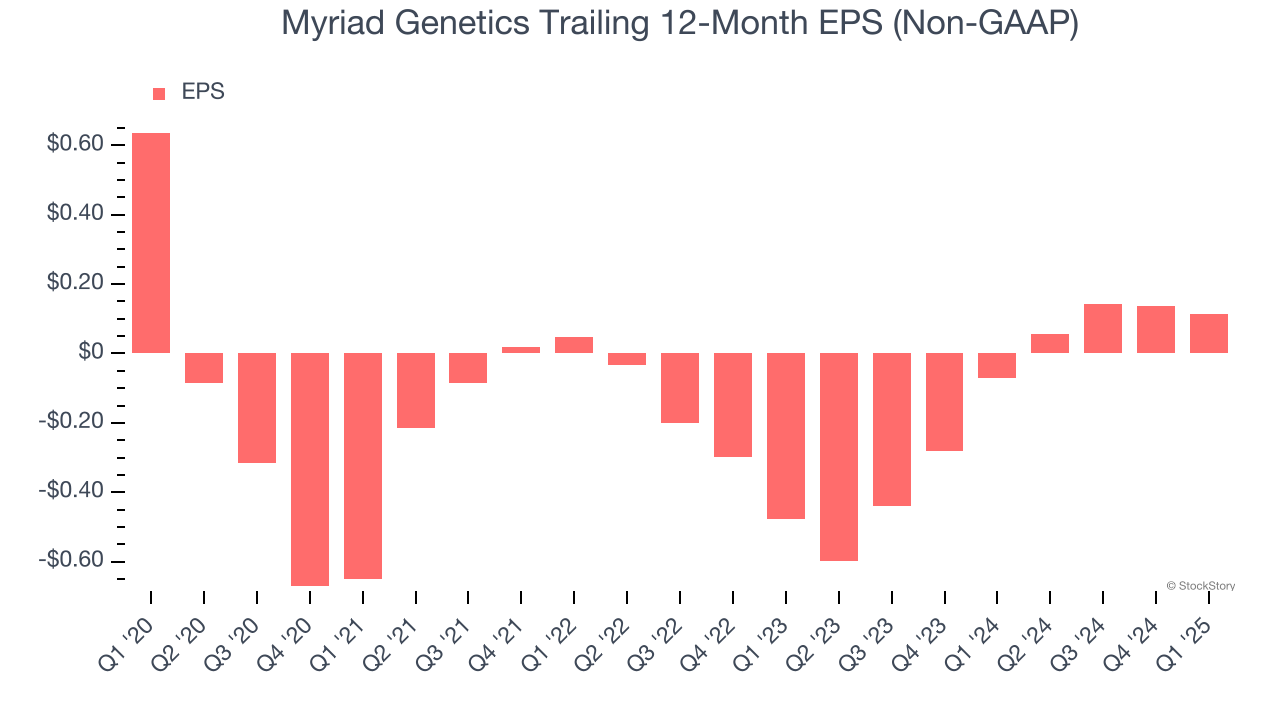
Diving into the nuances of Myriad Genetics’s earnings can give us a better understanding of its performance. A five-year view shows Myriad Genetics has diluted its shareholders, growing its share count by 22.7%. This dilution overshadowed its increased operating efficiency and has led to lower per share earnings. Taxes and interest expenses can also affect EPS but don’t tell us as much about a company’s fundamentals. 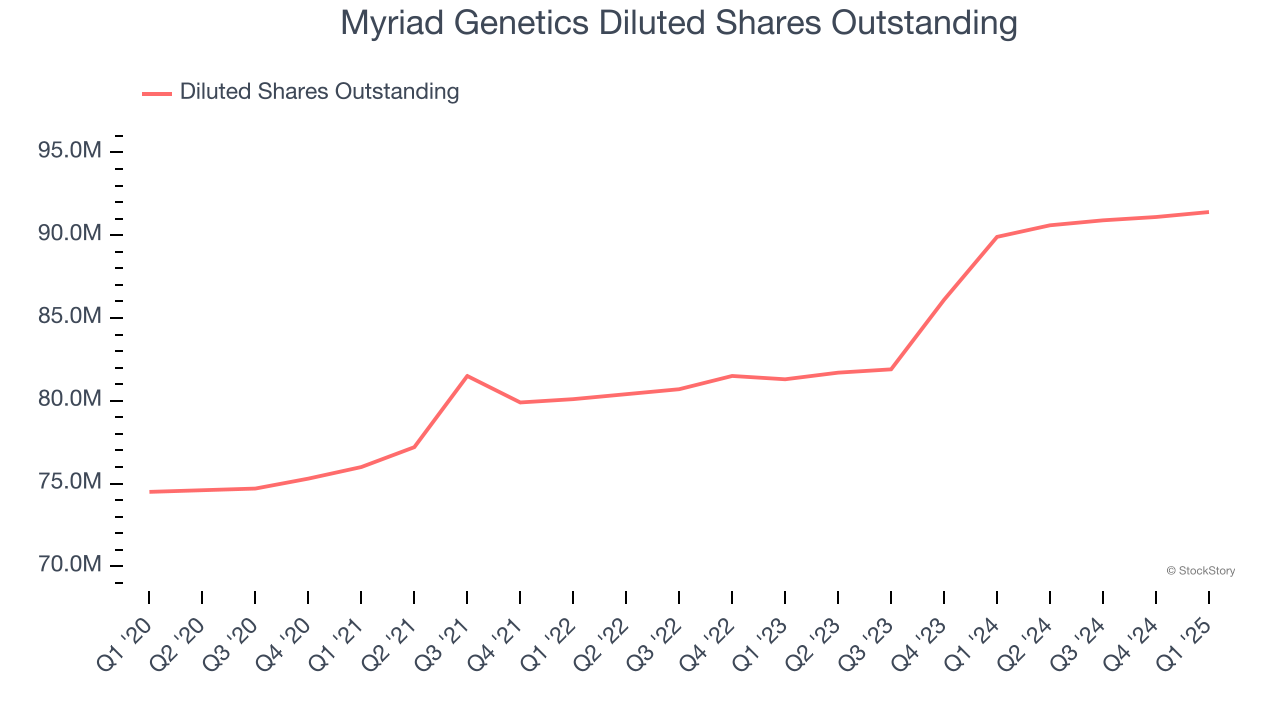
In Q1, Myriad Genetics reported EPS at negative $0.03, down from negative $0.01 in the same quarter last year. Despite falling year on year, this print easily cleared analysts’ estimates. Over the next 12 months, Wall Street expects Myriad Genetics to perform poorly. Analysts forecast its full-year EPS of $0.11 will hit $0.13.
Key Takeaways from Myriad Genetics’s Q1 Results
We were impressed by how significantly Myriad Genetics blew past analysts’ EPS and EBITDA expectations this quarter. On the other hand, it lowered its full-year revenue, EPS, and EBITDA guidance due to weaker trends in its pharmacogenomics and hereditary cancer testing (women's health) businesses. Overall, this was a softer quarter. The stock traded down 14.5% to $6.20 immediately following the results.
Myriad Genetics may have had a tough quarter, but does that actually create an opportunity to invest right now? What happened in the latest quarter matters, but not as much as longer-term business quality and valuation, when deciding whether to invest in this stock. We cover that in our actionable full research report which you can read here, it’s free.


