
Medicine and manufacturing technology provider Novanta (NASDAQ: NOVT) met Wall Street’s revenue expectations in Q1 CY2025, with sales up 1.1% year on year to $233.4 million. On the other hand, next quarter’s revenue guidance of $235 million was less impressive, coming in 2.4% below analysts’ estimates. Its non-GAAP profit of $0.74 per share was 9.9% above analysts’ consensus estimates.
Is now the time to buy Novanta? Find out by accessing our full research report, it’s free.
Novanta (NOVT) Q1 CY2025 Highlights:
- Revenue: $233.4 million vs analyst estimates of $233.3 million (1.1% year-on-year growth, in line)
- Adjusted EPS: $0.74 vs analyst estimates of $0.67 (9.9% beat)
- Adjusted EBITDA: $49.98 million vs analyst estimates of $50.21 million (21.4% margin, in line)
- Revenue Guidance for Q2 CY2025 is $235 million at the midpoint, below analyst estimates of $240.7 million
- Adjusted EPS guidance for Q2 CY2025 is $0.73 at the midpoint, below analyst estimates of $0.75
- EBITDA guidance for Q2 CY2025 is $52.5 million at the midpoint, in line with analyst expectations
- Operating Margin: 13.9%, up from 12.1% in the same quarter last year
- Free Cash Flow Margin: 11.7%, similar to the same quarter last year
- Market Capitalization: $4.32 billion
Company Overview
Originally a pioneer in the laser scanning industry during the late 1960s, Novanta (NASDAQ: NOVT) offers medicine and manufacturing technology to the medical, life sciences, and manufacturing industries.
Sales Growth
Examining a company’s long-term performance can provide clues about its quality. Even a bad business can shine for one or two quarters, but a top-tier one grows for years. Over the last five years, Novanta grew its sales at a decent 8.8% compounded annual growth rate. Its growth was slightly above the average industrials company and shows its offerings resonate with customers.
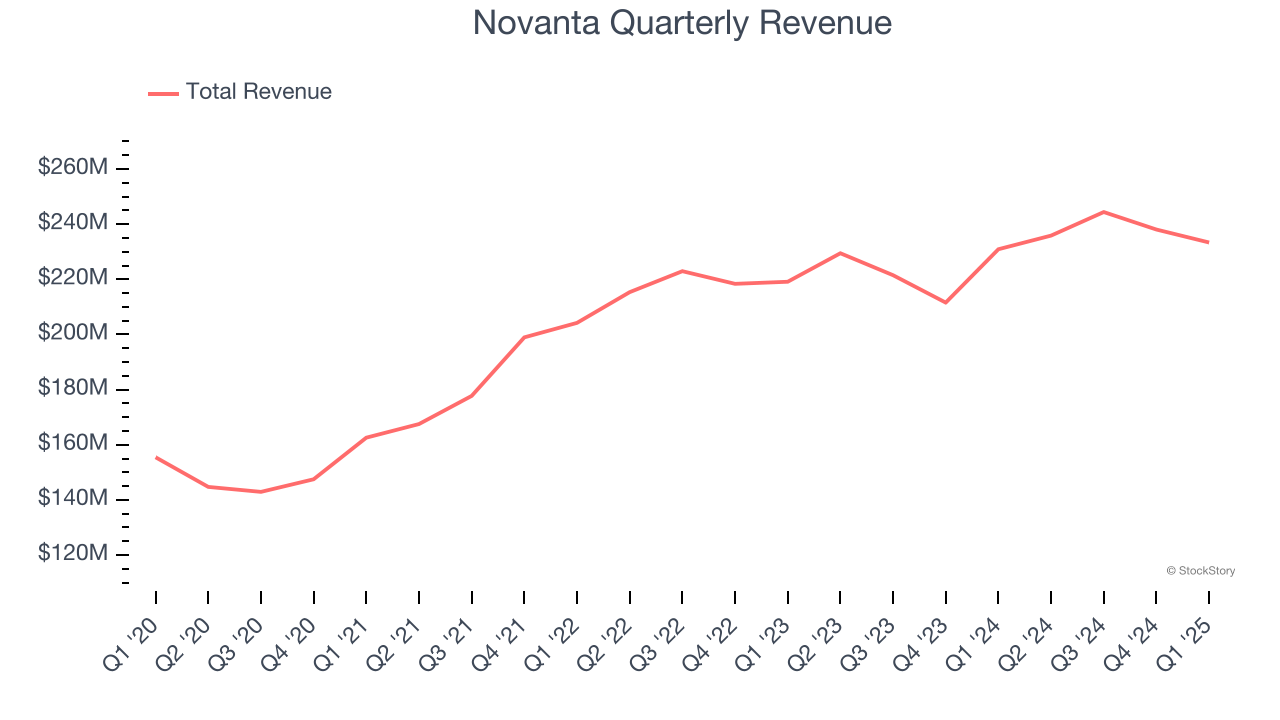
We at StockStory place the most emphasis on long-term growth, but within industrials, a half-decade historical view may miss cycles, industry trends, or a company capitalizing on catalysts such as a new contract win or a successful product line. Novanta’s recent performance shows its demand has slowed as its annualized revenue growth of 4.2% over the last two years was below its five-year trend. We also note many other Electronic Components businesses have faced declining sales because of cyclical headwinds. While Novanta grew slower than we’d like, it did do better than its peers. 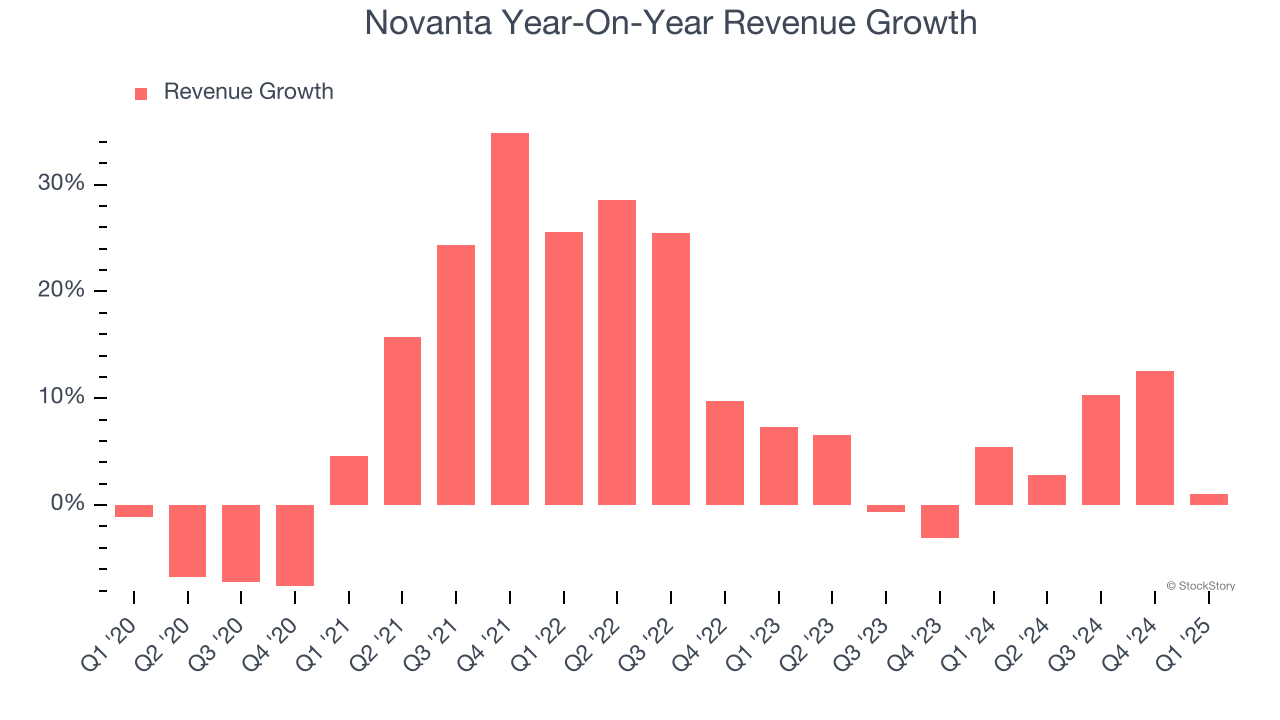
This quarter, Novanta grew its revenue by 1.1% year on year, and its $233.4 million of revenue was in line with Wall Street’s estimates. Company management is currently guiding for flat sales next quarter.
We also like to judge companies based on their projected revenue growth, but not enough Wall Street analysts cover the company for it to have reliable consensus estimates.
Here at StockStory, we certainly understand the potential of thematic investing. Diverse winners from Microsoft (MSFT) to Alphabet (GOOG), Coca-Cola (KO) to Monster Beverage (MNST) could all have been identified as promising growth stories with a megatrend driving the growth. So, in that spirit, we’ve identified a relatively under-the-radar profitable growth stock benefiting from the rise of AI, available to you FREE via this link.
Operating Margin
Novanta has been an efficient company over the last five years. It was one of the more profitable businesses in the industrials sector, boasting an average operating margin of 12.5%. This result isn’t surprising as its high gross margin gives it a favorable starting point.
Analyzing the trend in its profitability, Novanta’s operating margin rose by 3.8 percentage points over the last five years, as its sales growth gave it operating leverage.
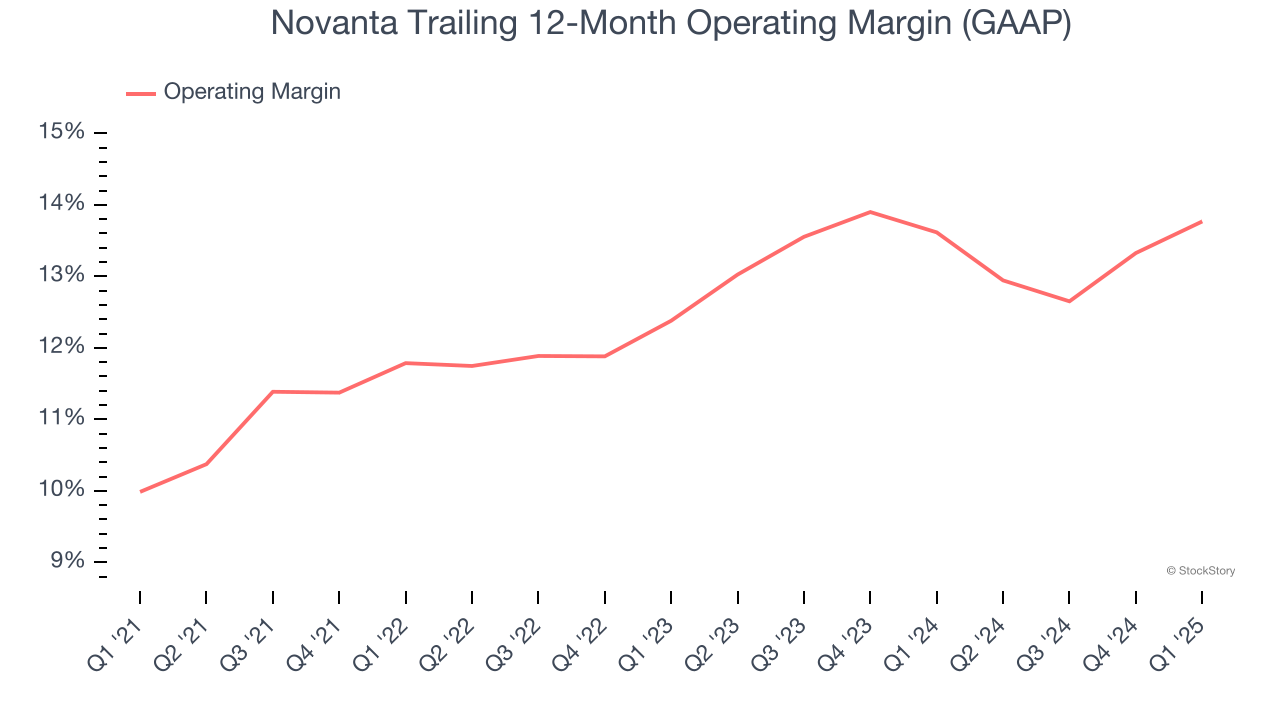
This quarter, Novanta generated an operating profit margin of 13.9%, up 1.8 percentage points year on year. The increase was encouraging, and because its operating margin rose more than its gross margin, we can infer it was more efficient with expenses such as marketing, R&D, and administrative overhead.
Earnings Per Share
Revenue trends explain a company’s historical growth, but the long-term change in earnings per share (EPS) points to the profitability of that growth – for example, a company could inflate its sales through excessive spending on advertising and promotions.
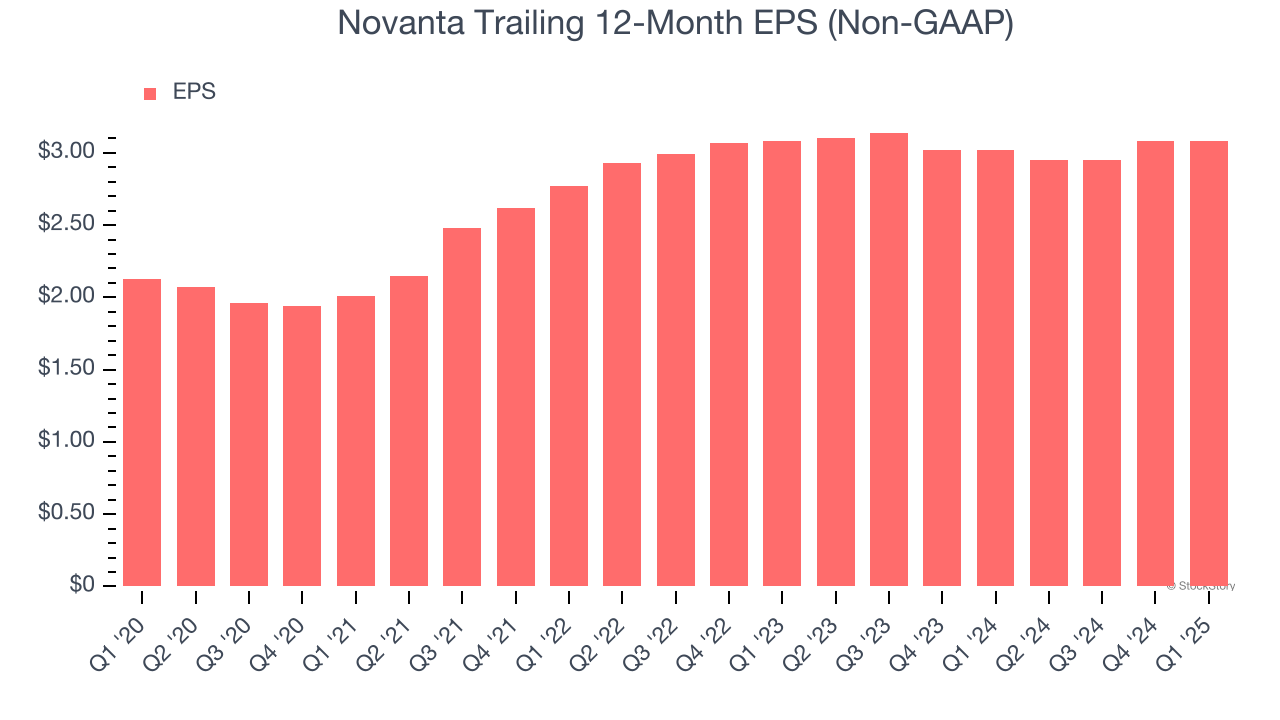
Novanta’s EPS grew at an unimpressive 7.7% compounded annual growth rate over the last five years, lower than its 8.8% annualized revenue growth. However, its operating margin actually expanded during this time, telling us that non-fundamental factors such as interest expenses and taxes affected its ultimate earnings.
Diving into the nuances of Novanta’s earnings can give us a better understanding of its performance. A five-year view shows Novanta has diluted its shareholders, growing its share count by 1.6%. This dilution overshadowed its increased operating efficiency and has led to lower per share earnings. Taxes and interest expenses can also affect EPS but don’t tell us as much about a company’s fundamentals. 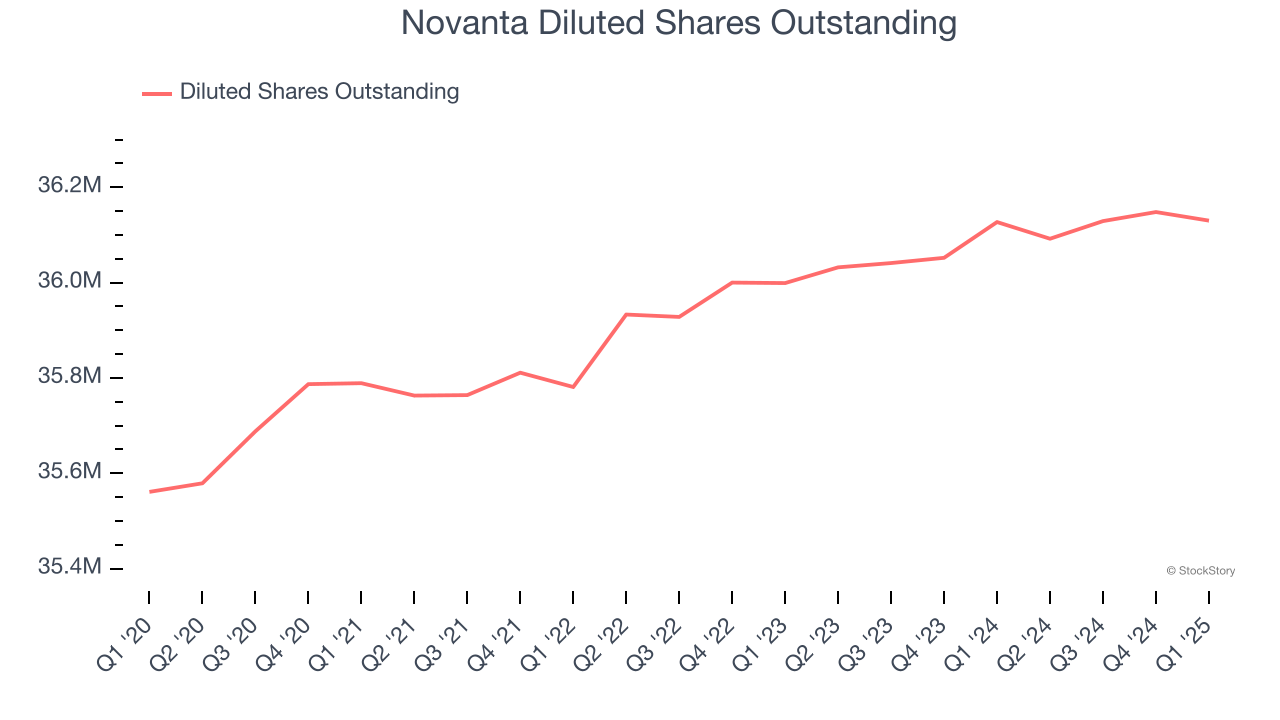
Like with revenue, we analyze EPS over a more recent period because it can provide insight into an emerging theme or development for the business.
For Novanta, EPS didn’t budge over the last two years, a regression from its five-year trend. We hope it can revert to earnings growth in the coming years.
In Q1, Novanta reported EPS at $0.74, in line with the same quarter last year. This print beat analysts’ estimates by 9.9%. We also like to analyze expected EPS growth based on Wall Street analysts’ consensus projections, but there is insufficient data.
Key Takeaways from Novanta’s Q1 Results
It was encouraging to see Novanta beat analysts’ EPS expectations this quarter. On the other hand, its revenue and EPS guidance for next quarter fell short. Overall, this quarter could have been better. The stock traded down 12.3% to $105.01 immediately following the results.
Should you buy the stock or not? We think that the latest quarter is only one piece of the longer-term business quality puzzle. Quality, when combined with valuation, can help determine if the stock is a buy. We cover that in our actionable full research report which you can read here, it’s free.


