Electric vehicle manufacturer Rivian (NASDAQ: RIVN) reported revenue ahead of Wall Street’s expectations in Q1 CY2025, with sales up 3% year on year to $1.24 billion. Its non-GAAP loss of $0.41 per share was 44.4% above analysts’ consensus estimates.
Is now the time to buy Rivian? Find out by accessing our full research report, it’s free.
Rivian (RIVN) Q1 CY2025 Highlights:
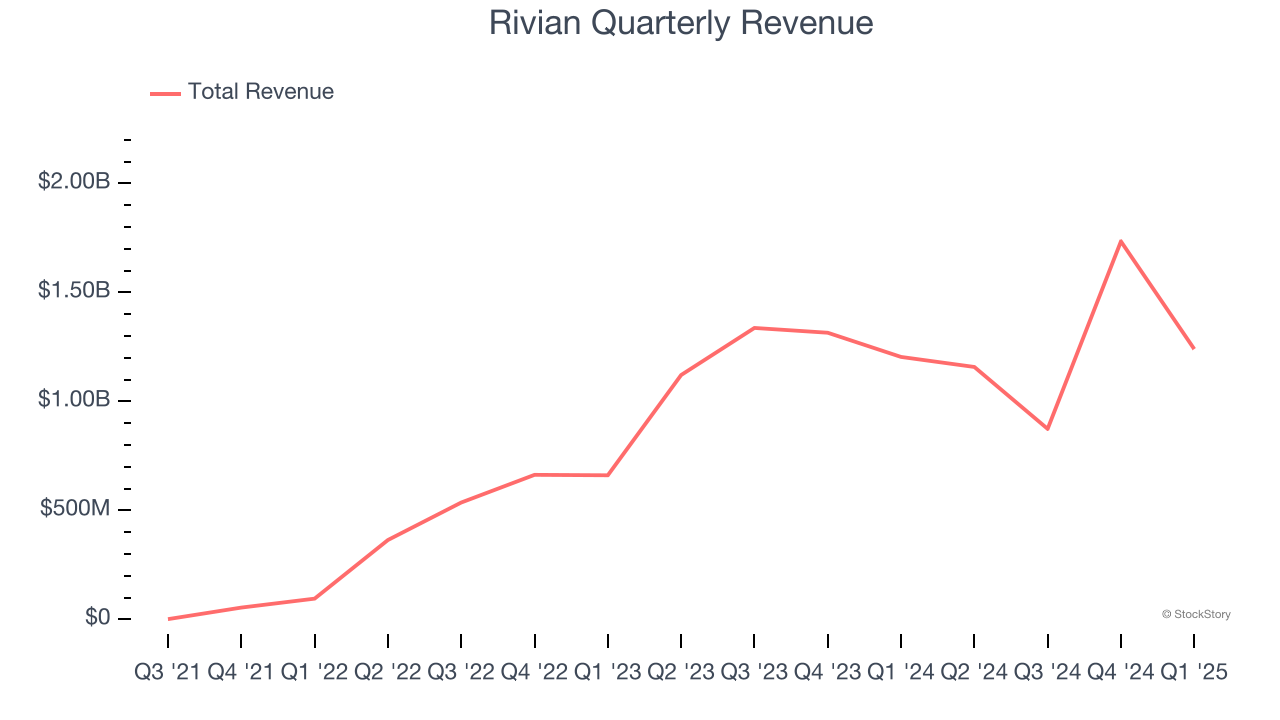
- Revenue: $1.24 billion vs analyst estimates of $997.3 million (3% year-on-year growth, 24.3% beat)
- Adjusted EPS: -$0.41 vs analyst estimates of -$0.74 (44.4% beat)
- Adjusted EBITDA: -$329 million vs analyst estimates of -$546.9 million (-26.5% margin, 39.8% beat)
- EBITDA guidance for the full year is -$1.8 billion at the midpoint, above analyst estimates of -$1.89 billion
- Operating Margin: -52.8%, up from -123% in the same quarter last year
- Free Cash Flow was -$526 million compared to -$1.52 billion in the same quarter last year
- Sales Volumes fell 36.4% year on year (71% in the same quarter last year)
- Market Capitalization: $15.53 billion
Company Overview
The manufacturer of Amazon’s delivery trucks, Rivian (NASDAQ: RIVN) designs, manufactures, and sells electric vehicles and commercial delivery vans.
Sales Growth
A company’s long-term sales performance can indicate its overall quality. Any business can put up a good quarter or two, but the best consistently grow over the long haul. Luckily, Rivian’s sales grew at an incredible 195% compounded annual growth rate over the last three years. Its growth beat the average industrials company and shows its offerings resonate with customers.
Long-term growth is the most important, but within industrials, a stretched historical view may miss new industry trends or demand cycles. Rivian’s annualized revenue growth of 50% over the last two years is below its three-year trend, but we still think the results suggest healthy demand. 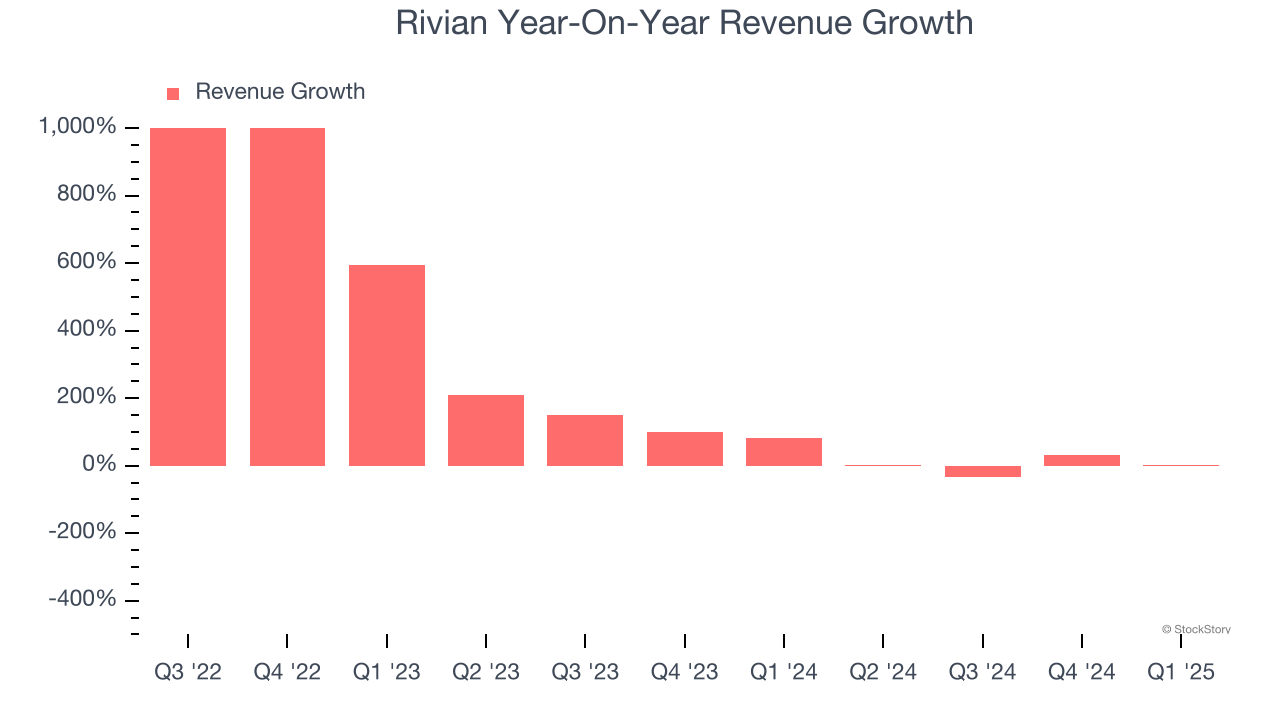
We can better understand the company’s revenue dynamics by analyzing its number of vehicles delivered, which reached 8,640 in the latest quarter. Over the last two years, Rivian’s vehicles delivered grew by 31.3% annually. Because this number is lower than its revenue growth, we can see the company benefited from price increases. 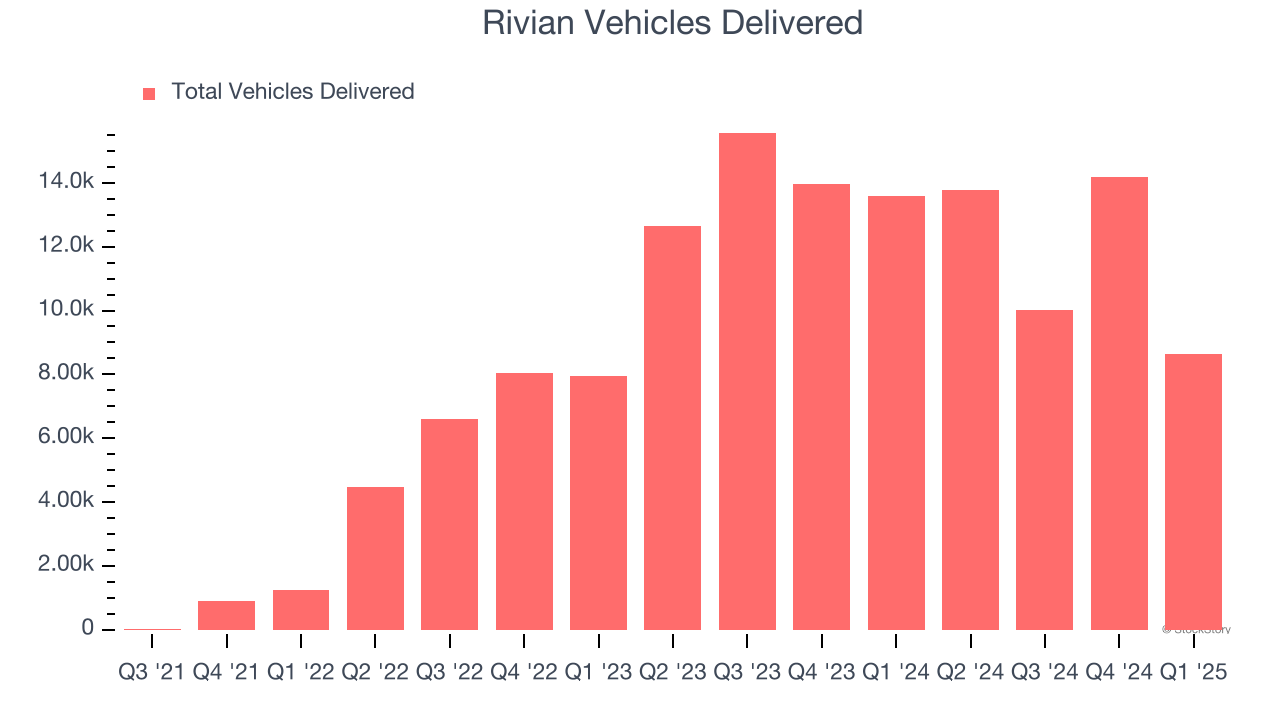
This quarter, Rivian reported modest year-on-year revenue growth of 3% but beat Wall Street’s estimates by 24.3%.
Looking ahead, sell-side analysts expect revenue to grow 16.4% over the next 12 months, a deceleration versus the last two years. Despite the slowdown, this projection is commendable and implies the market is baking in success for its products and services.
Here at StockStory, we certainly understand the potential of thematic investing. Diverse winners from Microsoft (MSFT) to Alphabet (GOOG), Coca-Cola (KO) to Monster Beverage (MNST) could all have been identified as promising growth stories with a megatrend driving the growth. So, in that spirit, we’ve identified a relatively under-the-radar profitable growth stock benefiting from the rise of AI, available to you FREE via this link.
Operating Margin
Operating margin is one of the best measures of profitability because it tells us how much money a company takes home after procuring and manufacturing its products, marketing and selling those products, and most importantly, keeping them relevant through research and development.
Rivian’s high expenses have contributed to an average operating margin of negative 170% over the last four years. Unprofitable industrials companies require extra attention because they could get caught swimming naked when the tide goes out. It’s hard to trust that the business can endure a full cycle.
On the plus side, Rivian’s operating margin rose over the last four years, as its sales growth gave it operating leverage. Still, it will take much more for the company to reach long-term profitability.
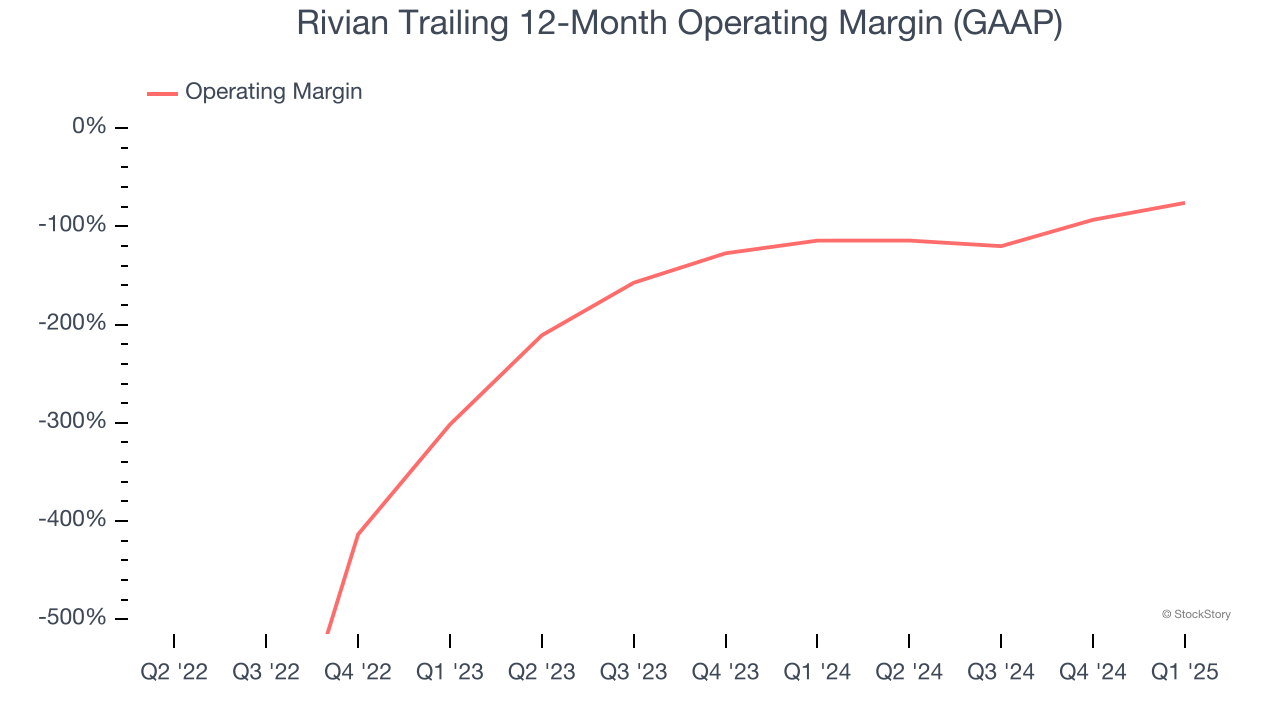
In Q1, Rivian generated a negative 52.8% operating margin. The company's consistent lack of profits raise a flag.
Earnings Per Share
We track the long-term change in earnings per share (EPS) for the same reason as long-term revenue growth. Compared to revenue, however, EPS highlights whether a company’s growth is profitable.
Although Rivian’s full-year earnings are still negative, it reduced its losses and improved its EPS by 15.1% annually over the last five years. The next few quarters will be critical for assessing its long-term profitability. We hope to see an inflection point soon, especially since it recently diluted shareholders by forming a $5.8 billion joint venture with Volkswagen in November 2024.
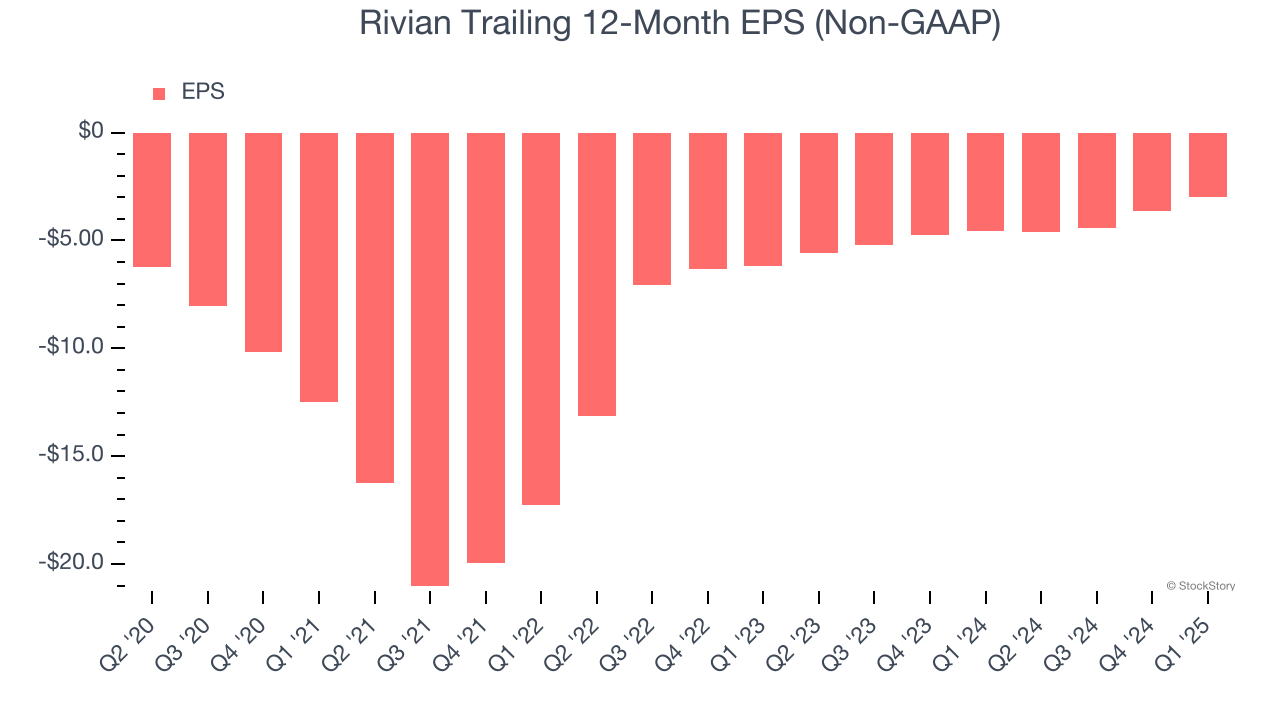
Like with revenue, we analyze EPS over a more recent period because it can provide insight into an emerging theme or development for the business.
For Rivian, its two-year annual EPS growth of 30.4% was higher than its five-year trend. We love it when earnings improve, but a caveat is that its EPS is still in the red.
In Q1, Rivian reported EPS at negative $0.41, up from negative $1.06 in the same quarter last year. This print easily cleared analysts’ estimates, and shareholders should be content with the results. Over the next 12 months, Wall Street expects Rivian to improve its earnings losses. Analysts forecast its full-year EPS of negative $2.99 will advance to negative $2.57.
Key Takeaways from Rivian’s Q1 Results
We were impressed by how significantly Rivian blew past analysts’ revenue, EPS, and EBITDA expectations this quarter. We were also excited its full-year EBITDA guidance topped Wall Street’s estimates. Zooming out, we think this quarter featured some important positives. The stock remained flat at $13.43 immediately following the results.
Is Rivian an attractive investment opportunity at the current price? When making that decision, it’s important to consider its valuation, business qualities, as well as what has happened in the latest quarter. We cover that in our actionable full research report which you can read here, it’s free.