Theater company AMC Entertainment (NYSE: AMC) missed Wall Street’s revenue expectations in Q1 CY2025, with sales falling 9.3% year on year to $862.5 million. Its non-GAAP loss of $0.58 per share was 4.4% above analysts’ consensus estimates.
Is now the time to buy AMC Entertainment? Find out by accessing our full research report, it’s free.
AMC Entertainment (AMC) Q1 CY2025 Highlights:
- Revenue: $862.5 million vs analyst estimates of $868.2 million (9.3% year-on-year decline, 0.7% miss)
- Adjusted EPS: -$0.58 vs analyst estimates of -$0.61 (4.4% beat)
- Adjusted EBITDA: -$58 million vs analyst estimates of -$68.69 million (-6.7% margin, 15.6% beat)
- Operating Margin: -16.9%, down from -11.4% in the same quarter last year
- Free Cash Flow was -$417 million compared to -$238.8 million in the same quarter last year
- Market Capitalization: $1.16 billion
Company Overview
With a profile that was raised due to meme stock mania beginning in 2021, AMC Entertainment (NYSE: AMC) operates movie theaters primarily in the US and Europe.
Sales Growth
A company’s long-term performance is an indicator of its overall quality. Any business can put up a good quarter or two, but many enduring ones grow for years. Over the last five years, AMC Entertainment’s demand was weak and its revenue declined by 2.7% per year. This wasn’t a great result and suggests it’s a lower quality business.
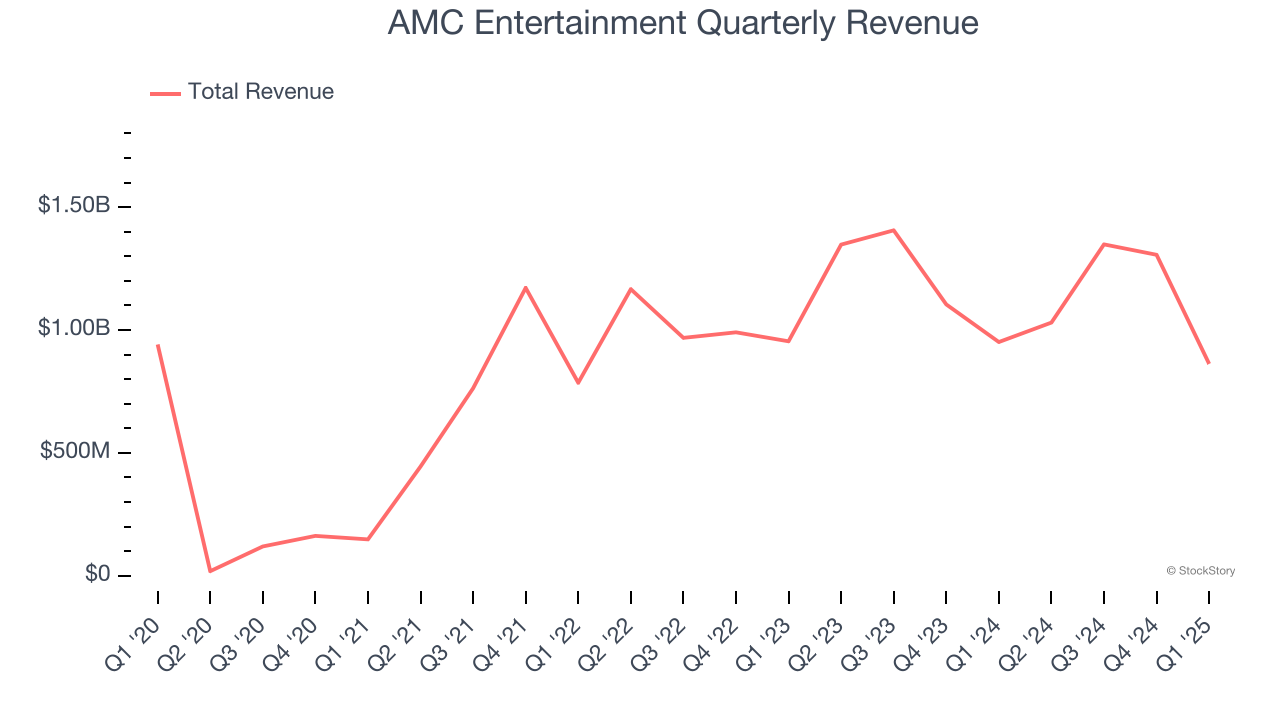
Long-term growth is the most important, but within consumer discretionary, product cycles are short and revenue can be hit-driven due to rapidly changing trends and consumer preferences. AMC Entertainment’s annualized revenue growth of 5.6% over the last two years is above its five-year trend, but we were still disappointed by the results. Note that COVID hurt AMC Entertainment’s business in 2020 and part of 2021, and it bounced back in a big way thereafter. 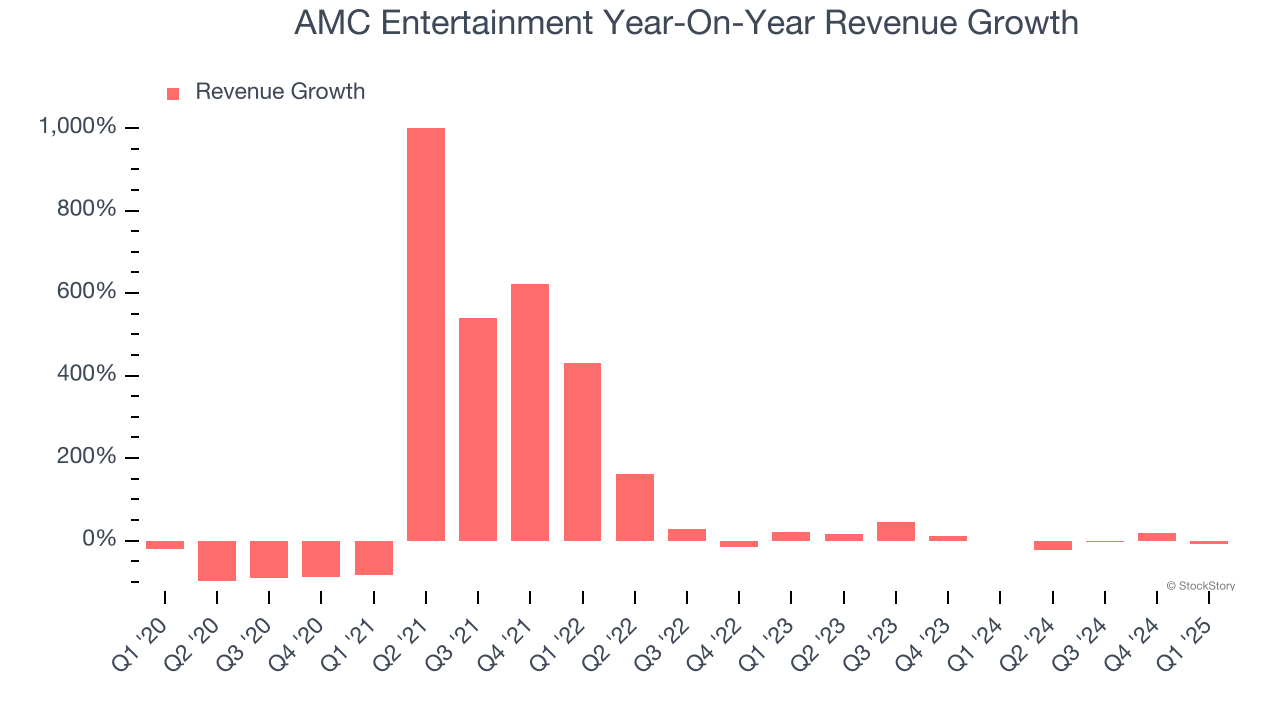
This quarter, AMC Entertainment missed Wall Street’s estimates and reported a rather uninspiring 9.3% year-on-year revenue decline, generating $862.5 million of revenue.
Looking ahead, sell-side analysts expect revenue to grow 12.3% over the next 12 months. While this projection implies its newer products and services will spur better top-line performance, it is still below the sector average.
Software is eating the world and there is virtually no industry left that has been untouched by it. That drives increasing demand for tools helping software developers do their jobs, whether it be monitoring critical cloud infrastructure, integrating audio and video functionality, or ensuring smooth content streaming. Click here to access a free report on our 3 favorite stocks to play this generational megatrend.
Operating Margin
Operating margin is an important measure of profitability as it shows the portion of revenue left after accounting for all core expenses – everything from the cost of goods sold to advertising and wages. It’s also useful for comparing profitability across companies with different levels of debt and tax rates because it excludes interest and taxes.
AMC Entertainment’s operating margin has shrunk over the last 12 months and averaged negative 2% over the last two years. Unprofitable consumer discretionary companies with falling margins deserve extra scrutiny because they’re spending loads of money to stay relevant, an unsustainable practice.
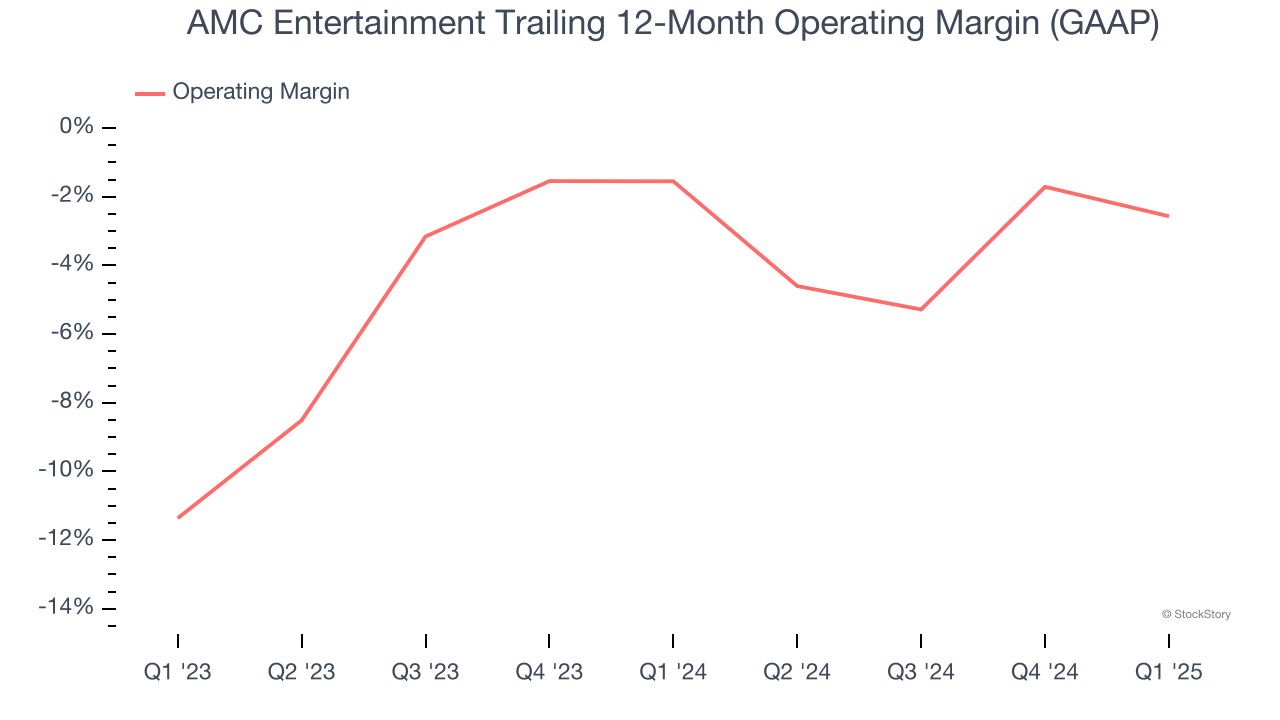
This quarter, AMC Entertainment generated a negative 16.9% operating margin. The company's consistent lack of profits raise a flag.
Earnings Per Share
We track the long-term change in earnings per share (EPS) for the same reason as long-term revenue growth. Compared to revenue, however, EPS highlights whether a company’s growth is profitable.
Although AMC Entertainment’s full-year earnings are still negative, it reduced its losses and improved its EPS by 46.3% annually over the last five years. The next few quarters will be critical for assessing its long-term profitability.
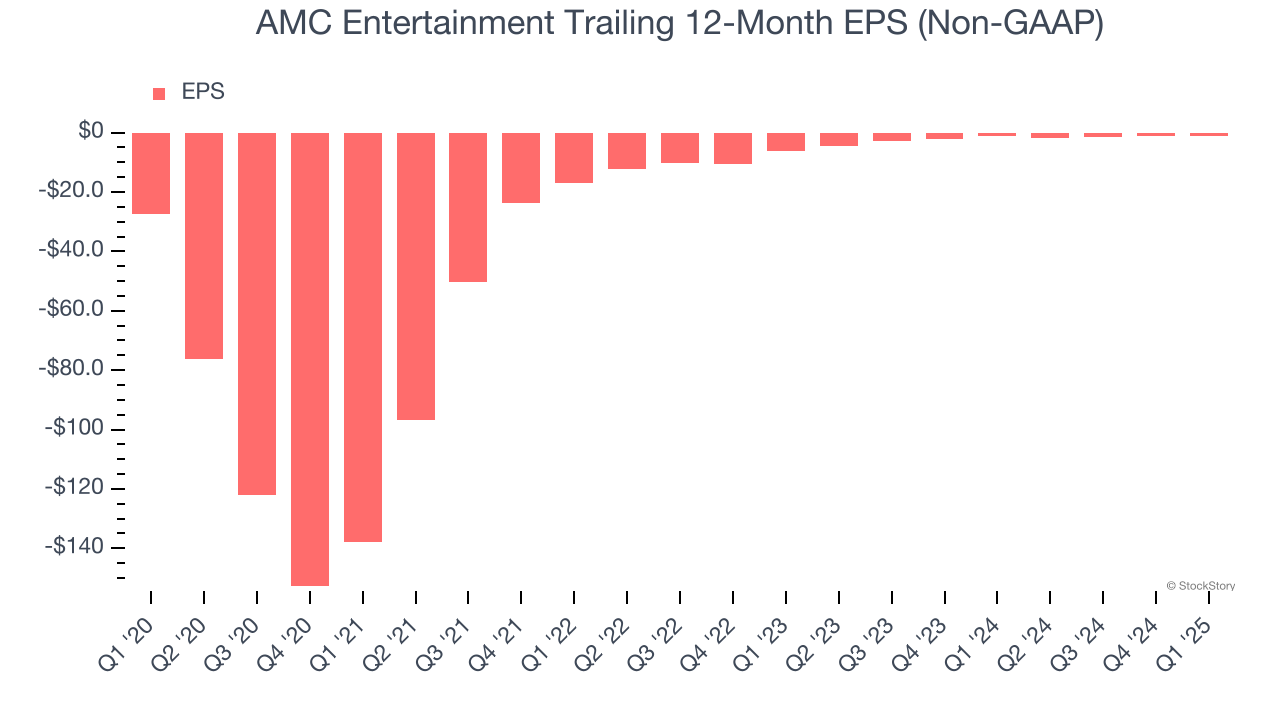
In Q1, AMC Entertainment reported EPS at negative $0.58, up from negative $0.62 in the same quarter last year. This print beat analysts’ estimates by 4.4%. Over the next 12 months, Wall Street is optimistic. Analysts forecast AMC Entertainment’s full-year EPS of negative $1.23 will reach break even.
Key Takeaways from AMC Entertainment’s Q1 Results
We enjoyed seeing AMC Entertainment beat analysts’ EPS and EBITDA expectations this quarter. On the other hand, its revenue slightly missed. Overall, this print had some key positives. The stock remained flat at $2.70 immediately following the results.
Should you buy the stock or not? What happened in the latest quarter matters, but not as much as longer-term business quality and valuation, when deciding whether to invest in this stock. We cover that in our actionable full research report which you can read here, it’s free.