Banking and retail technology provider Diebold Nixdorf (NYSE: DBD) missed Wall Street’s revenue expectations in Q1 CY2025, with sales falling 6.1% year on year to $841.1 million. Its GAAP loss of $0.22 per share was significantly below analysts’ consensus estimates.
Is now the time to buy Diebold Nixdorf? Find out by accessing our full research report, it’s free.
Diebold Nixdorf (DBD) Q1 CY2025 Highlights:
- Revenue: $841.1 million vs analyst estimates of $845.8 million (6.1% year-on-year decline, 0.6% miss)
- EPS (GAAP): -$0.22 vs analyst estimates of $0.14 (significant miss)
- Adjusted EBITDA: $87.3 million vs analyst estimates of $85.33 million (10.4% margin, 2.3% beat)
- EBITDA guidance for the full year is $480 million at the midpoint, in line with analyst expectations
- Operating Margin: 3.5%, in line with the same quarter last year
- Free Cash Flow was $6.1 million, up from -$36.4 million in the same quarter last year
- Market Capitalization: $1.70 billion
Company Overview
With roots dating back to 1859 and a presence in over 100 countries, Diebold Nixdorf (NYSE: DBD) provides automated self-service technology, software, and services that help banks and retailers digitize their customer transactions.
Sales Growth
A company’s long-term sales performance can indicate its overall quality. Any business can have short-term success, but a top-tier one grows for years.
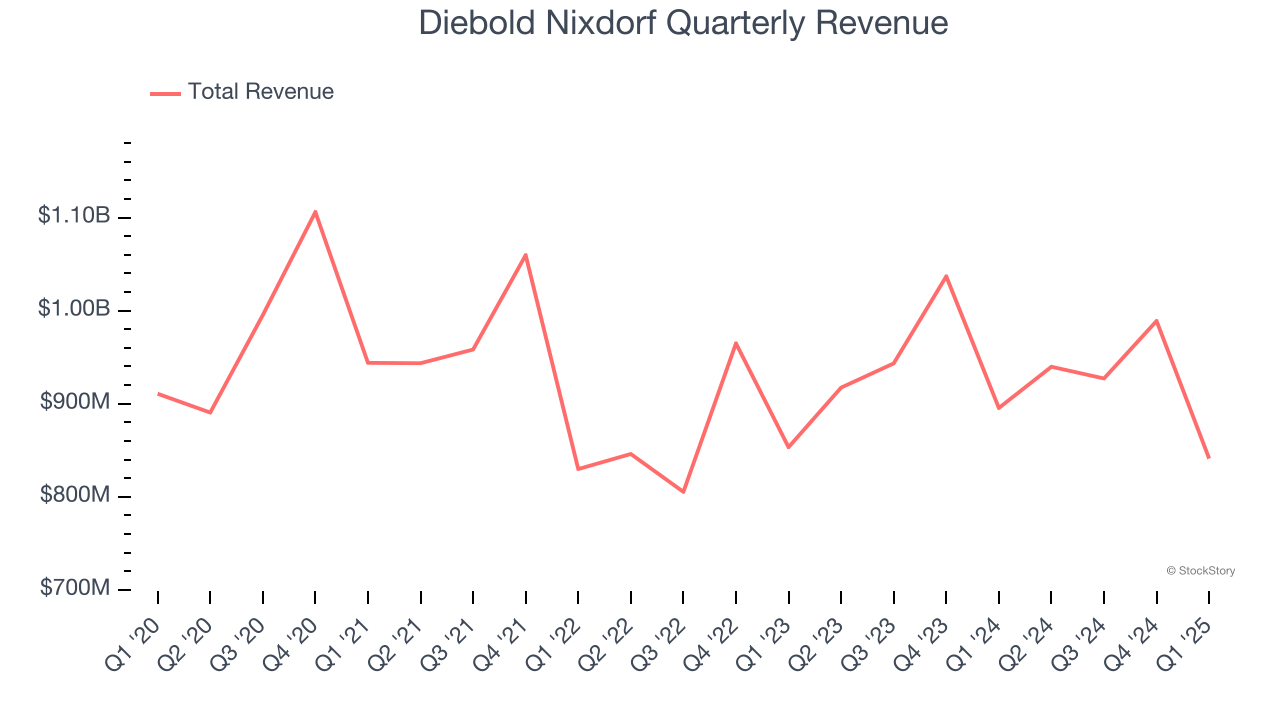
With $3.70 billion in revenue over the past 12 months, Diebold Nixdorf is a mid-sized business services company, which sometimes brings disadvantages compared to larger competitors benefiting from better economies of scale.
As you can see below, Diebold Nixdorf’s revenue declined by 2.9% per year over the last five years, a poor baseline for our analysis.
We at StockStory place the most emphasis on long-term growth, but within business services, a half-decade historical view may miss recent innovations or disruptive industry trends. Diebold Nixdorf’s annualized revenue growth of 3.2% over the last two years is above its five-year trend, but we were still disappointed by the results. 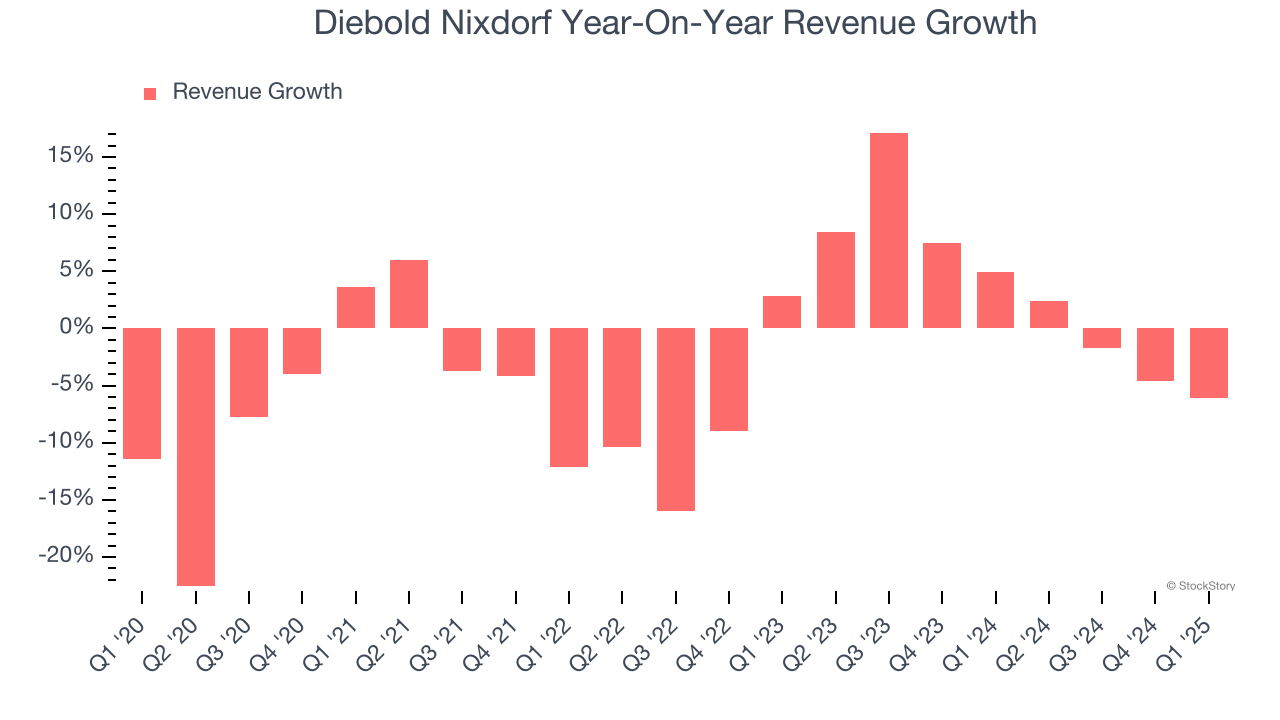
This quarter, Diebold Nixdorf missed Wall Street’s estimates and reported a rather uninspiring 6.1% year-on-year revenue decline, generating $841.1 million of revenue.
Looking ahead, sell-side analysts expect revenue to grow 2.5% over the next 12 months, similar to its two-year rate. This projection is underwhelming and indicates its newer products and services will not lead to better top-line performance yet.
Today’s young investors won’t have read the timeless lessons in Gorilla Game: Picking Winners In High Technology because it was written more than 20 years ago when Microsoft and Apple were first establishing their supremacy. But if we apply the same principles, then enterprise software stocks leveraging their own generative AI capabilities may well be the Gorillas of the future. So, in that spirit, we are excited to present our Special Free Report on a profitable, fast-growing enterprise software stock that is already riding the automation wave and looking to catch the generative AI next.
Operating Margin
Diebold Nixdorf was profitable over the last five years but held back by its large cost base. Its average operating margin of 1.6% was weak for a business services business.
On the plus side, Diebold Nixdorf’s operating margin rose by 2.9 percentage points over the last five years.
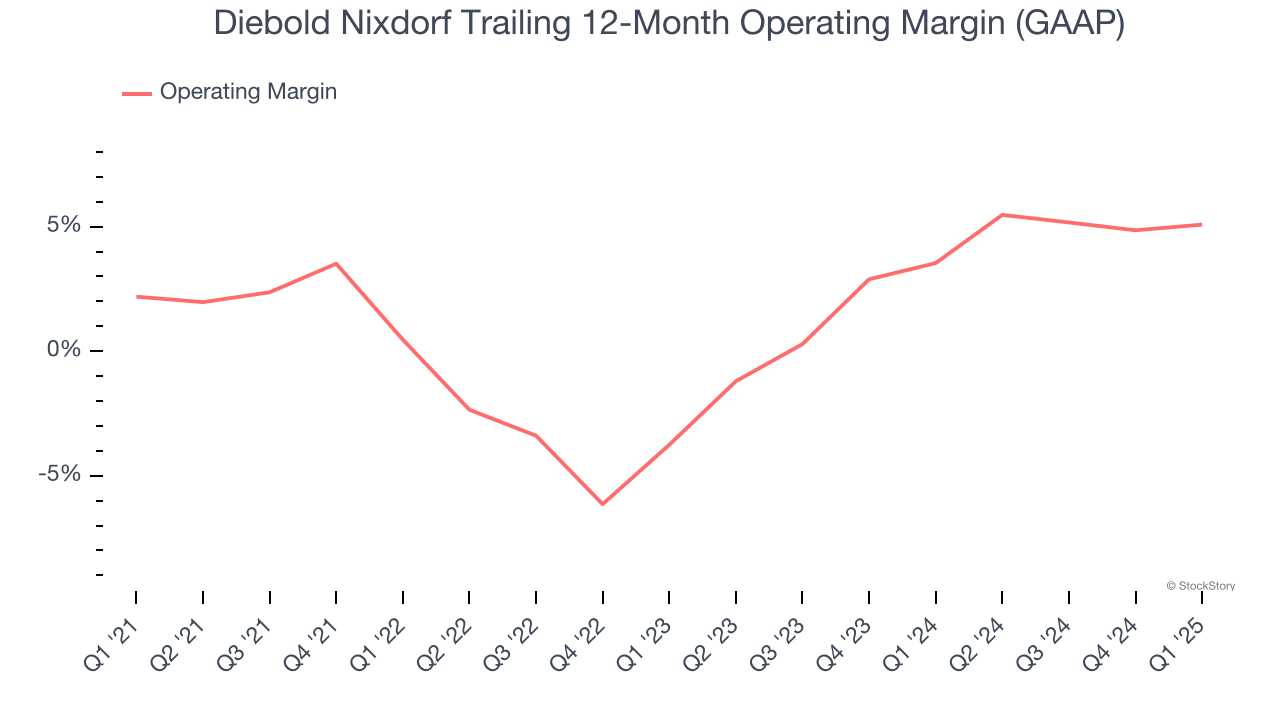
This quarter, Diebold Nixdorf generated an operating profit margin of 3.5%, in line with the same quarter last year. This indicates the company’s overall cost structure has been relatively stable.
Earnings Per Share
Revenue trends explain a company’s historical growth, but the long-term change in earnings per share (EPS) points to the profitability of that growth – for example, a company could inflate its sales through excessive spending on advertising and promotions.
Although Diebold Nixdorf’s full-year earnings are still negative, it reduced its losses and improved its EPS by 36.4% annually over the last five years. The next few quarters will be critical for assessing its long-term profitability.
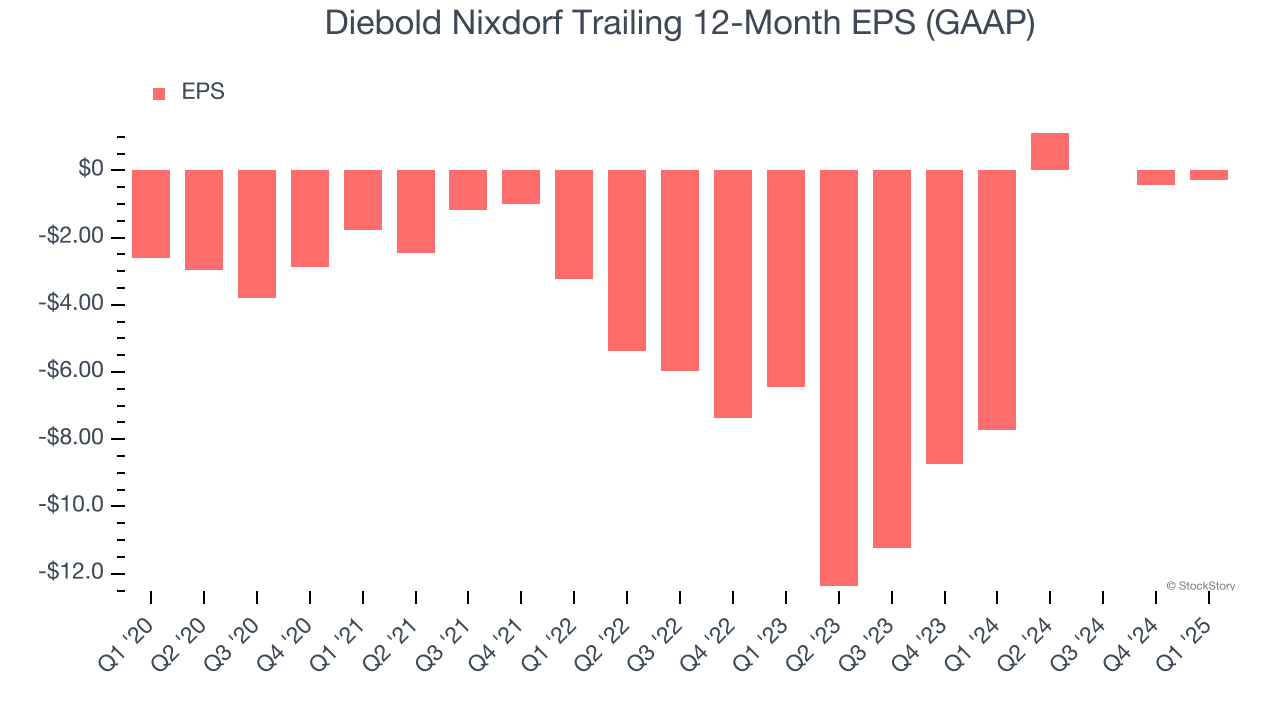
In Q1, Diebold Nixdorf reported EPS at negative $0.22, up from negative $0.39 in the same quarter last year. Despite growing year on year, this print missed analysts’ estimates. Over the next 12 months, Wall Street is optimistic. Analysts forecast Diebold Nixdorf’s full-year EPS of negative $0.27 will flip to positive $3.07.
Key Takeaways from Diebold Nixdorf’s Q1 Results
It was good to see DBD beat analysts' EBITDA expectations. On the other hand, its EPS missed significantly and its revenue fell slightly short of Wall Street’s estimates. Overall, this was a softer quarter, but the stock traded up 3.6% to $47 immediately following the results.
Should you buy the stock or not? We think that the latest quarter is only one piece of the longer-term business quality puzzle. Quality, when combined with valuation, can help determine if the stock is a buy. We cover that in our actionable full research report which you can read here, it’s free.