
Coffee chain Dutch Bros (NYSE: BROS) beat Wall Street’s revenue expectations in Q1 CY2025, with sales up 29.1% year on year to $355.2 million. On the other hand, the company’s full-year revenue guidance of $1.57 billion at the midpoint came in 1.2% below analysts’ estimates. Its non-GAAP profit of $0.14 per share was 32.7% above analysts’ consensus estimates.
Is now the time to buy Dutch Bros? Find out by accessing our full research report, it’s free.
Dutch Bros (BROS) Q1 CY2025 Highlights:
- Revenue: $355.2 million vs analyst estimates of $344.8 million (29.1% year-on-year growth, 3% beat)
- Adjusted EPS: $0.14 vs analyst estimates of $0.11 (32.7% beat)
- Adjusted EBITDA: $62.91 million vs analyst estimates of $57.13 million (17.7% margin, 10.1% beat)
- The company reconfirmed its revenue guidance for the full year of $1.57 billion at the midpoint
- EBITDA guidance for the full year is $270 million at the midpoint, below analyst estimates of $276.9 million
- Operating Margin: 8.7%, in line with the same quarter last year
- Locations: 1,012 at quarter end, up from 876 in the same quarter last year
- Same-Store Sales rose 4.7% year on year (10% in the same quarter last year)
- Market Capitalization: $7.46 billion
Company Overview
Started in 1992 by two brothers as a single pushcart, Dutch Bros (NYSE: BROS) is a dynamic coffee chain that’s captured the hearts of coffee enthusiasts across the United States.
Sales Growth
A company’s long-term sales performance can indicate its overall quality. Even a bad business can shine for one or two quarters, but a top-tier one grows for years.
With $1.36 billion in revenue over the past 12 months, Dutch Bros is a mid-sized restaurant chain, which sometimes brings disadvantages compared to larger competitors benefiting from better brand awareness and economies of scale. On the bright side, it can still flex high growth rates because it’s working from a smaller revenue base.
As you can see below, Dutch Bros’s sales grew at an incredible 39.9% compounded annual growth rate over the last five years (we compare to 2019 to normalize for COVID-19 impacts) as it opened new restaurants and increased sales at existing, established dining locations.
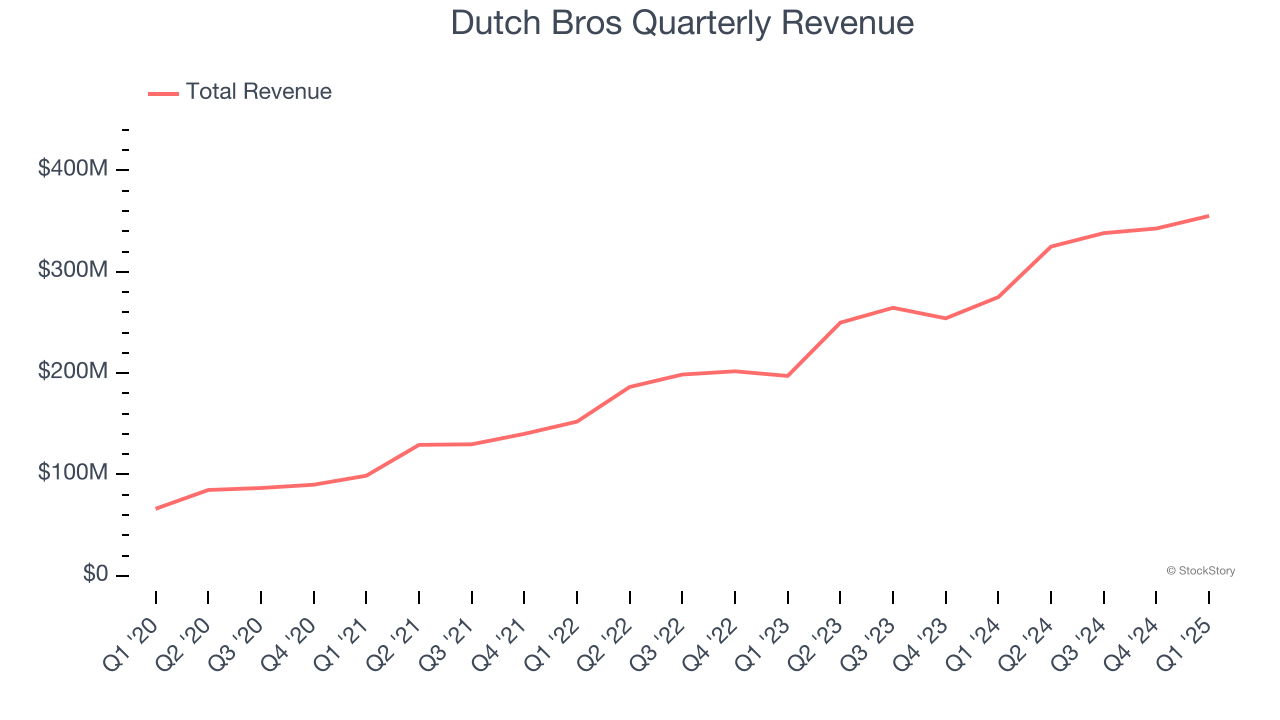
This quarter, Dutch Bros reported robust year-on-year revenue growth of 29.1%, and its $355.2 million of revenue topped Wall Street estimates by 3%.
Looking ahead, sell-side analysts expect revenue to grow 22.4% over the next 12 months, a deceleration versus the last five years. Despite the slowdown, this projection is admirable and implies the market sees success for its menu offerings.
Today’s young investors won’t have read the timeless lessons in Gorilla Game: Picking Winners In High Technology because it was written more than 20 years ago when Microsoft and Apple were first establishing their supremacy. But if we apply the same principles, then enterprise software stocks leveraging their own generative AI capabilities may well be the Gorillas of the future. So, in that spirit, we are excited to present our Special Free Report on a profitable, fast-growing enterprise software stock that is already riding the automation wave and looking to catch the generative AI next.
Restaurant Performance
Number of Restaurants
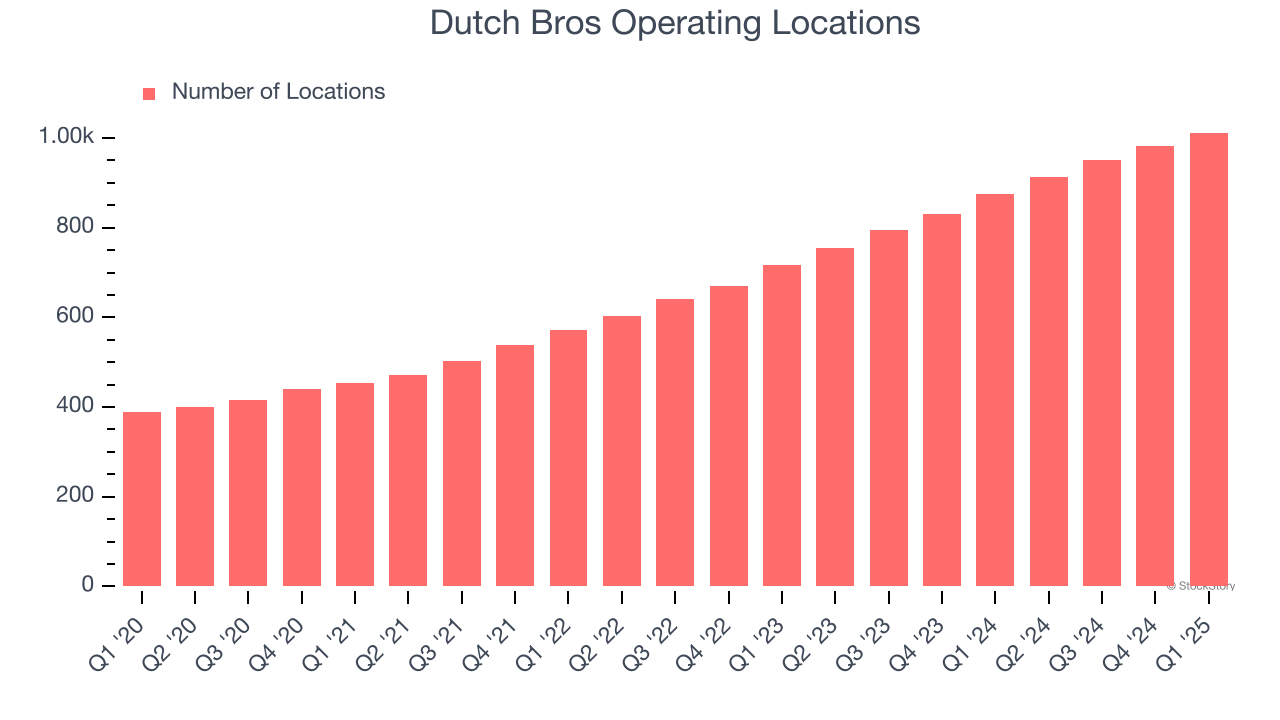
The number of dining locations a restaurant chain operates is a critical driver of how quickly company-level sales can grow.
Dutch Bros sported 1,012 locations in the latest quarter. Over the last two years, it has opened new restaurants at a rapid clip by averaging 21.2% annual growth, among the fastest in the restaurant sector. This gives it a chance to become a large, scaled business over time.
When a chain opens new restaurants, it usually means it’s investing for growth because there’s healthy demand for its meals and there are markets where its concepts have few or no locations.
Same-Store Sales
The change in a company's restaurant base only tells one side of the story. The other is the performance of its existing locations, which informs management teams whether they should expand or downsize their physical footprints. Same-store sales gives us insight into this topic because it measures organic growth at restaurants open for at least a year.
Dutch Bros has been one of the most successful restaurant chains over the last two years thanks to skyrocketing demand within its existing dining locations. On average, the company has posted exceptional year-on-year same-store sales growth of 5.2%. This performance along with its meaningful buildout of new restaurants suggest it’s playing some aggressive offense.
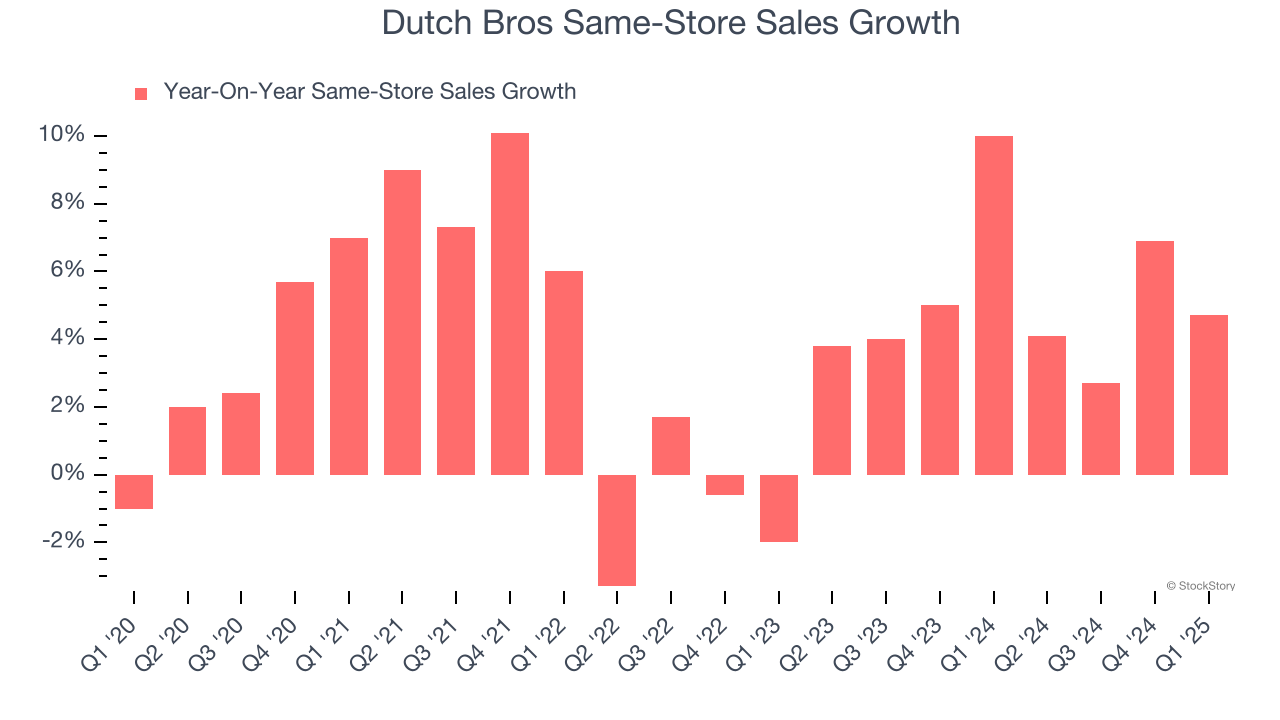
In the latest quarter, Dutch Bros’s same-store sales rose 4.7% year on year. This performance was more or less in line with its historical levels.
Key Takeaways from Dutch Bros’s Q1 Results
We were impressed by how significantly Dutch Bros blew past analysts’ EBITDA expectations this quarter. We were also excited its revenue outperformed Wall Street’s estimates by a wide margin. On the other hand, its full-year revenue guidance slightly missed and its full-year EBITDA guidance fell short of Wall Street’s estimates. Overall, this print was mixed but still had some key positives. The stock traded up 4.6% to $61.80 immediately following the results.
Dutch Bros had an encouraging quarter, but one earnings result doesn’t necessarily make the stock a buy. Let’s see if this is a good investment. When making that decision, it’s important to consider its valuation, business qualities, as well as what has happened in the latest quarter. We cover that in our actionable full research report which you can read here, it’s free.
