
Behavioral health company LifeStance Health (NASDAQ: LFST) met Wall Street’s revenue expectations in Q1 CY2025, with sales up 10.8% year on year to $333 million. On the other hand, next quarter’s revenue guidance of $342 million was less impressive, coming in 2.7% below analysts’ estimates. Its GAAP loss of $0 per share was significantly above analysts’ consensus estimates.
Is now the time to buy LifeStance Health Group? Find out by accessing our full research report, it’s free.
LifeStance Health Group (LFST) Q1 CY2025 Highlights:
- Revenue: $333 million vs analyst estimates of $333.5 million (10.8% year-on-year growth, in line)
- EPS (GAAP): $0 vs analyst estimates of -$0.03 (significant beat)
- Adjusted EBITDA: $34.65 million vs analyst estimates of $30.23 million (10.4% margin, 14.6% beat)
- The company reconfirmed its revenue guidance for the full year of $1.42 billion at the midpoint
- EBITDA guidance for the full year is $140 million at the midpoint, in line with analyst expectations
- Operating Margin: 0.5%, up from -5.6% in the same quarter last year
- Free Cash Flow was -$10.26 million compared to -$26.94 million in the same quarter last year
- Sales Volumes rose 9.7% year on year (15.2% in the same quarter last year)
- Market Capitalization: $2.55 billion
“We delivered a solid quarter to kick off 2025, thanks to the commitment and dedication of our employees, including over 7,500 clinicians,” said Dave Bourdon, CEO of LifeStance.
Company Overview
With over 6,600 licensed mental health professionals treating more than 880,000 patients annually, LifeStance Health (NASDAQ: LFST) provides outpatient mental health services through a network of clinicians offering psychiatric evaluations, psychological testing, and therapy across 33 states.
Sales Growth
A company’s long-term sales performance is one signal of its overall quality. Even a bad business can shine for one or two quarters, but a top-tier one grows for years. Luckily, LifeStance Health Group’s sales grew at an incredible 39.2% compounded annual growth rate over the last five years. Its growth beat the average healthcare company and shows its offerings resonate with customers.
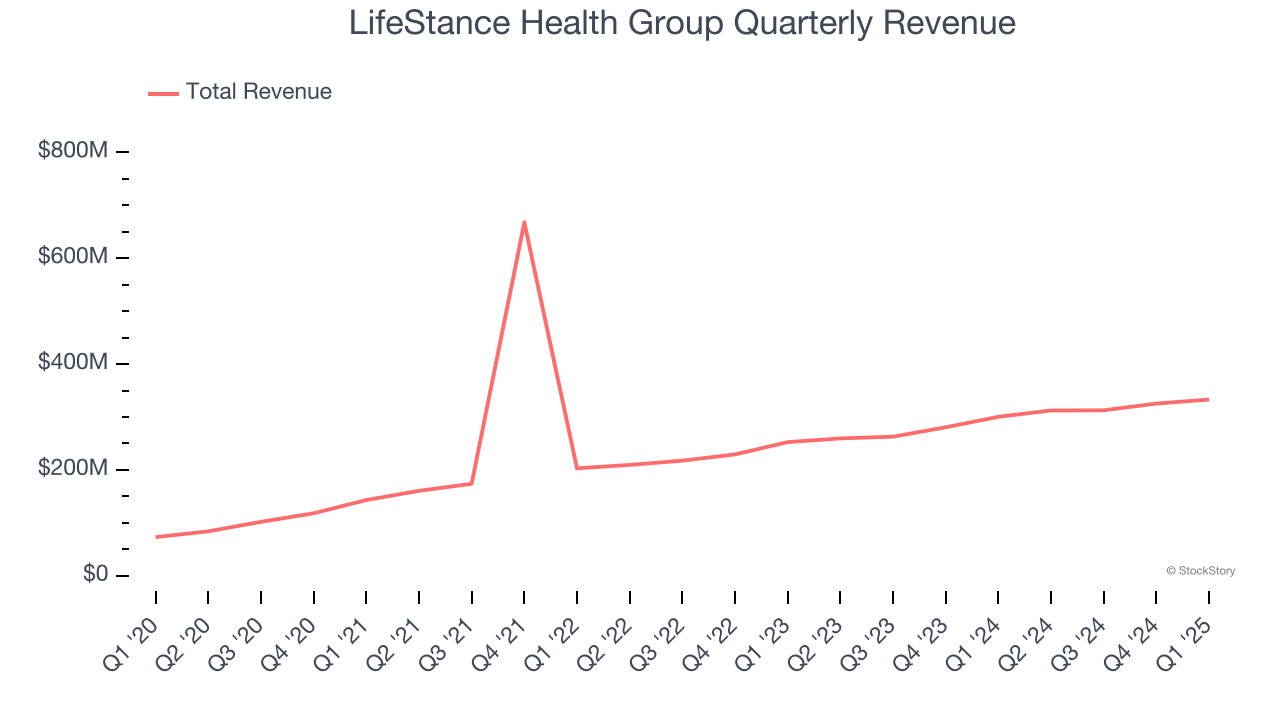
We at StockStory place the most emphasis on long-term growth, but within healthcare, a half-decade historical view may miss recent innovations or disruptive industry trends. LifeStance Health Group’s annualized revenue growth of 18.8% over the last two years is below its five-year trend, but we still think the results suggest healthy demand. 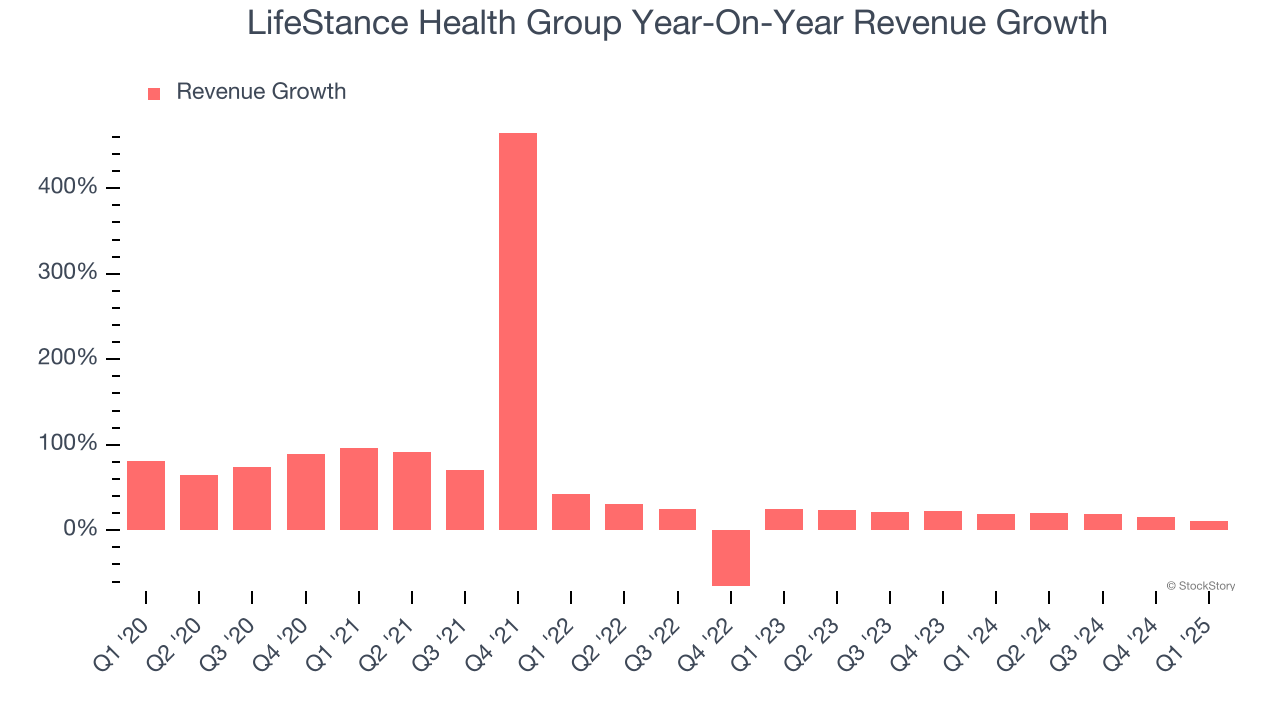
We can better understand the company’s revenue dynamics by analyzing its number of clinicians, which reached 7,535 in the latest quarter. Over the last two years, LifeStance Health Group’s clinicians averaged 14.7% year-on-year growth. Because this number is lower than its revenue growth, we can see the company benefited from price increases. 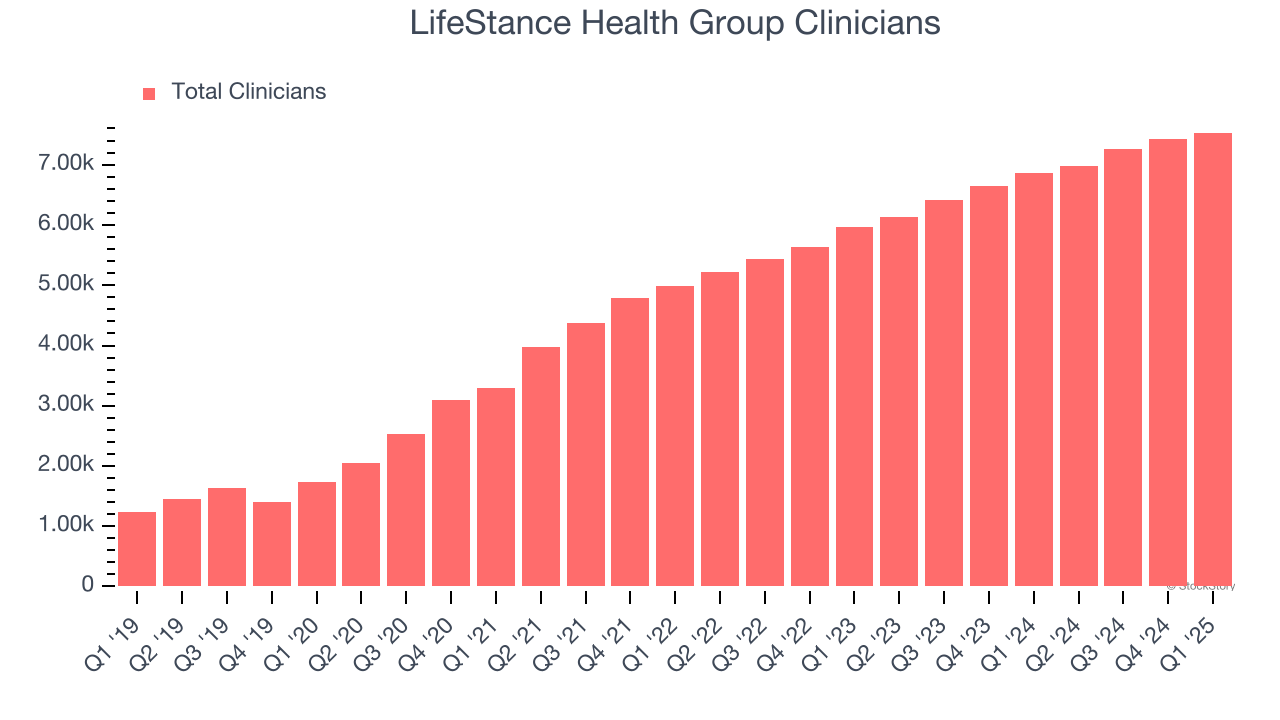
This quarter, LifeStance Health Group’s year-on-year revenue growth was 10.8%, and its $333 million of revenue was in line with Wall Street’s estimates. Company management is currently guiding for a 9.5% year-on-year increase in sales next quarter.
Looking further ahead, sell-side analysts expect revenue to grow 14.5% over the next 12 months, a deceleration versus the last two years. Still, this projection is noteworthy and indicates the market is baking in success for its products and services.
Today’s young investors won’t have read the timeless lessons in Gorilla Game: Picking Winners In High Technology because it was written more than 20 years ago when Microsoft and Apple were first establishing their supremacy. But if we apply the same principles, then enterprise software stocks leveraging their own generative AI capabilities may well be the Gorillas of the future. So, in that spirit, we are excited to present our Special Free Report on a profitable, fast-growing enterprise software stock that is already riding the automation wave and looking to catch the generative AI next.
Operating Margin
Operating margin is one of the best measures of profitability because it tells us how much money a company takes home after subtracting all core expenses, like marketing and R&D.
Although LifeStance Health Group broke even this quarter from an operational perspective, it’s generally struggled over a longer time period. Its expensive cost structure has contributed to an average operating margin of negative 14.3% over the last five years. Unprofitable healthcare companies require extra attention because they could get caught swimming naked when the tide goes out. It’s hard to trust that the business can endure a full cycle.
Analyzing the trend in its profitability, LifeStance Health Group’s operating margin decreased by 2.6 percentage points over the last five years, but it rose by 18.7 percentage points on a two-year basis. Still, shareholders will want to see LifeStance Health Group become more profitable in the future.
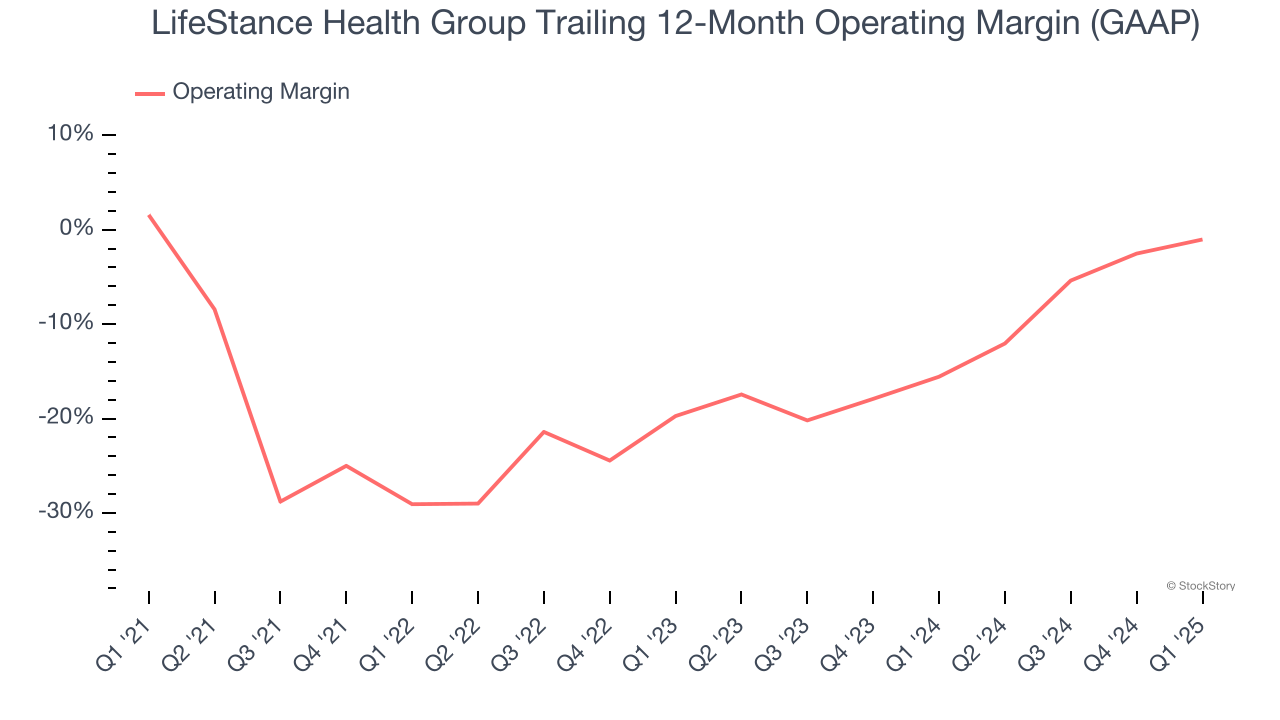
This quarter, LifeStance Health Group’s breakeven margin was up 6.1 percentage points year on year. This increase was a welcome development and shows it was more efficient.
Earnings Per Share
We track the long-term change in earnings per share (EPS) for the same reason as long-term revenue growth. Compared to revenue, however, EPS highlights whether a company’s growth is profitable.
Although LifeStance Health Group’s full-year earnings are still negative, it reduced its losses and improved its EPS by 30% annually over the last four years. The next few quarters will be critical for assessing its long-term profitability.
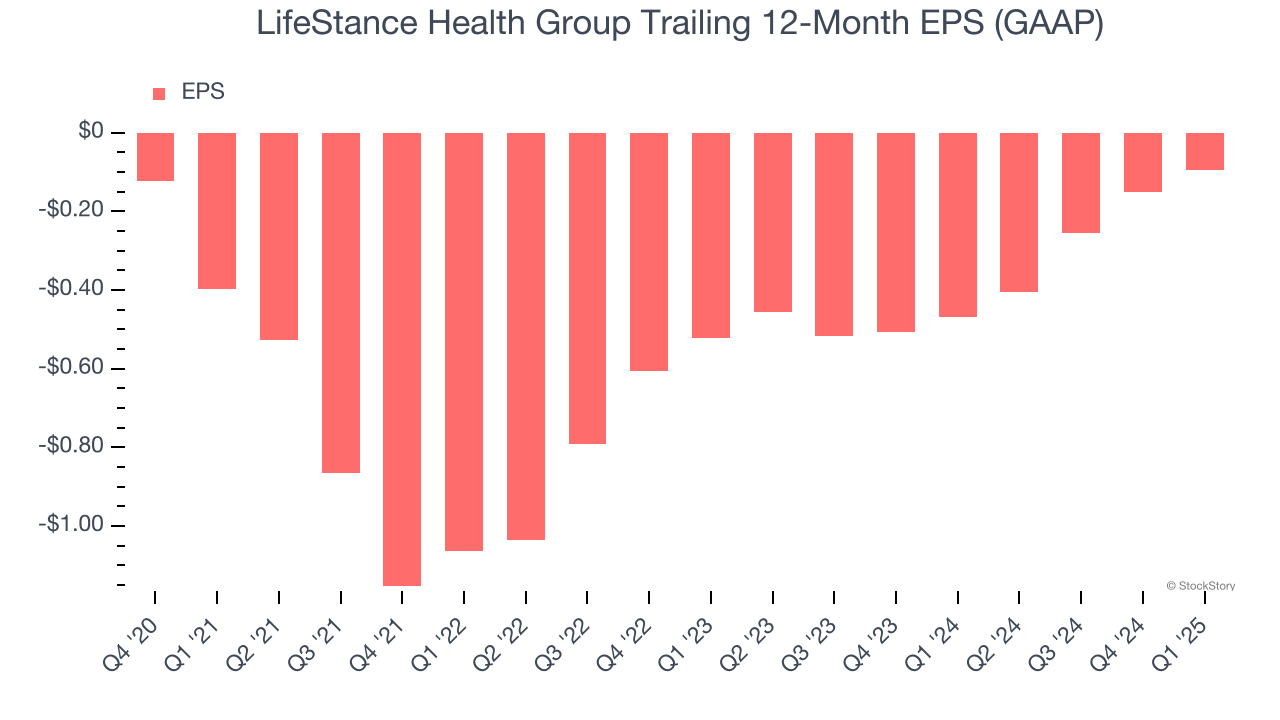
In Q1, LifeStance Health Group reported EPS at $0, up from negative $0.06 in the same quarter last year. This print easily cleared analysts’ estimates, and shareholders should be content with the results. Over the next 12 months, Wall Street is optimistic. Analysts forecast LifeStance Health Group’s full-year EPS of negative $0.10 will reach break even.
Key Takeaways from LifeStance Health Group’s Q1 Results
We were impressed by how significantly LifeStance Health Group blew past analysts’ EPS expectations this quarter. On the other hand, its revenue guidance for next quarter missed significantly and its EBITDA guidance for next quarter fell short of Wall Street’s estimates. Overall, this was a mixed quarter. The stock remained flat at $6.49 immediately after reporting.
Big picture, is LifeStance Health Group a buy here and now? When making that decision, it’s important to consider its valuation, business qualities, as well as what has happened in the latest quarter. We cover that in our actionable full research report which you can read here, it’s free.