
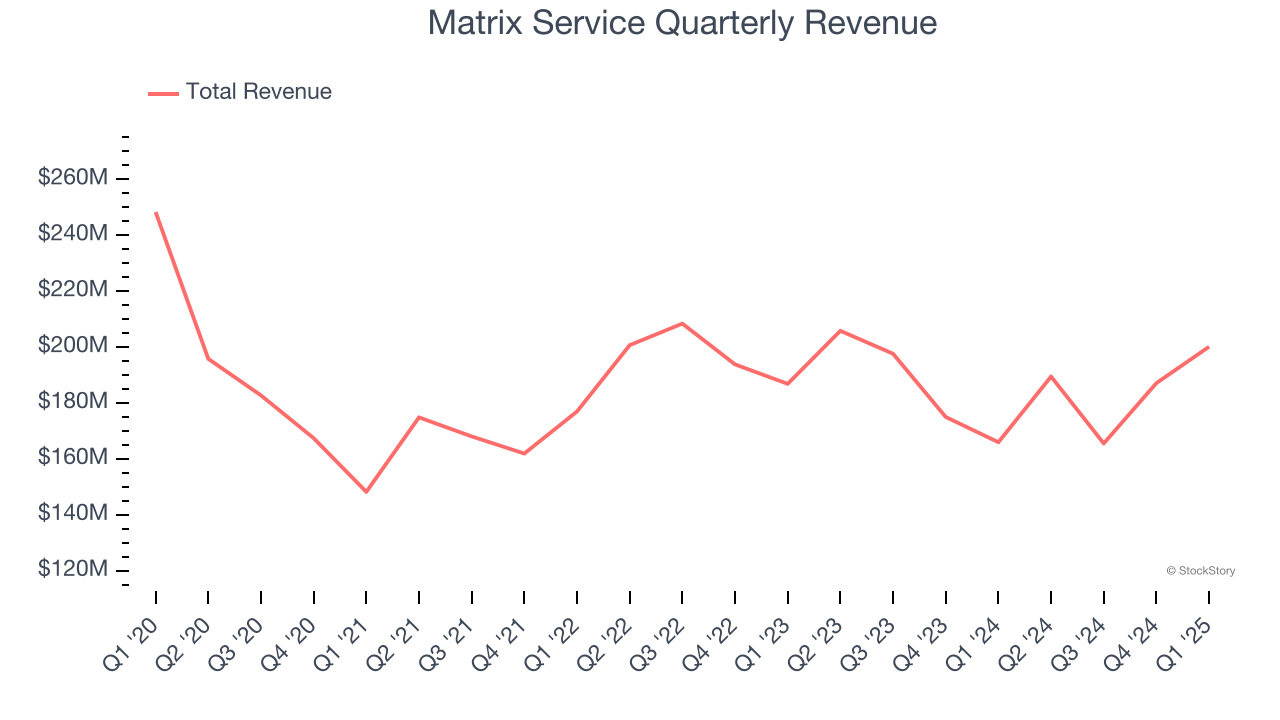
Industrial construction and maintenance company Matrix Service (NASDAQ: MTRX) fell short of the market’s revenue expectations in Q1 CY2025, but sales rose 20.6% year on year to $200.2 million. The company’s full-year revenue guidance of $785 million at the midpoint came in 8.1% below analysts’ estimates. Its non-GAAP loss of $0.12 per share was significantly below analysts’ consensus estimates.
Is now the time to buy Matrix Service? Find out by accessing our full research report, it’s free.
Matrix Service (MTRX) Q1 CY2025 Highlights:
- Revenue: $200.2 million vs analyst estimates of $215.1 million (20.6% year-on-year growth, 6.9% miss)
- Adjusted EPS: -$0.12 vs analyst estimates of -$0.05 (significant miss)
- Adjusted EBITDA: $5,000 vs analyst estimates of $334,500 (0% margin, relatively in line)
- The company dropped its revenue guidance for the full year to $785 million at the midpoint from $875 million, a 10.3% decrease
- Operating Margin: -2.5%, up from -8.7% in the same quarter last year
- Free Cash Flow Margin: 14.3%, up from 12.1% in the same quarter last year
- Backlog: $1.41 billion at quarter end
- Market Capitalization: $338.5 million
“Our third quarter results reflect accelerating revenue, supported by backlog growth which advances our return to profitability and enhances our visibility into future earnings,” said John Hewitt, President and Chief Executive Officer of Matrix Service Company.
Company Overview
Founded in Oklahoma, Matrix Service (NASDAQ: MTRX) provides engineering, fabrication, construction, and maintenance services primarily to the energy and industrial markets.
Sales Growth
A company’s long-term sales performance is one signal of its overall quality. Any business can experience short-term success, but top-performing ones enjoy sustained growth for years. Matrix Service’s demand was weak over the last five years as its sales fell at a 10.7% annual rate. This wasn’t a great result and is a sign of lacking business quality.
Long-term growth is the most important, but within industrials, a half-decade historical view may miss new industry trends or demand cycles. Matrix Service’s annualized revenue declines of 3.1% over the last two years suggest its demand continued shrinking. 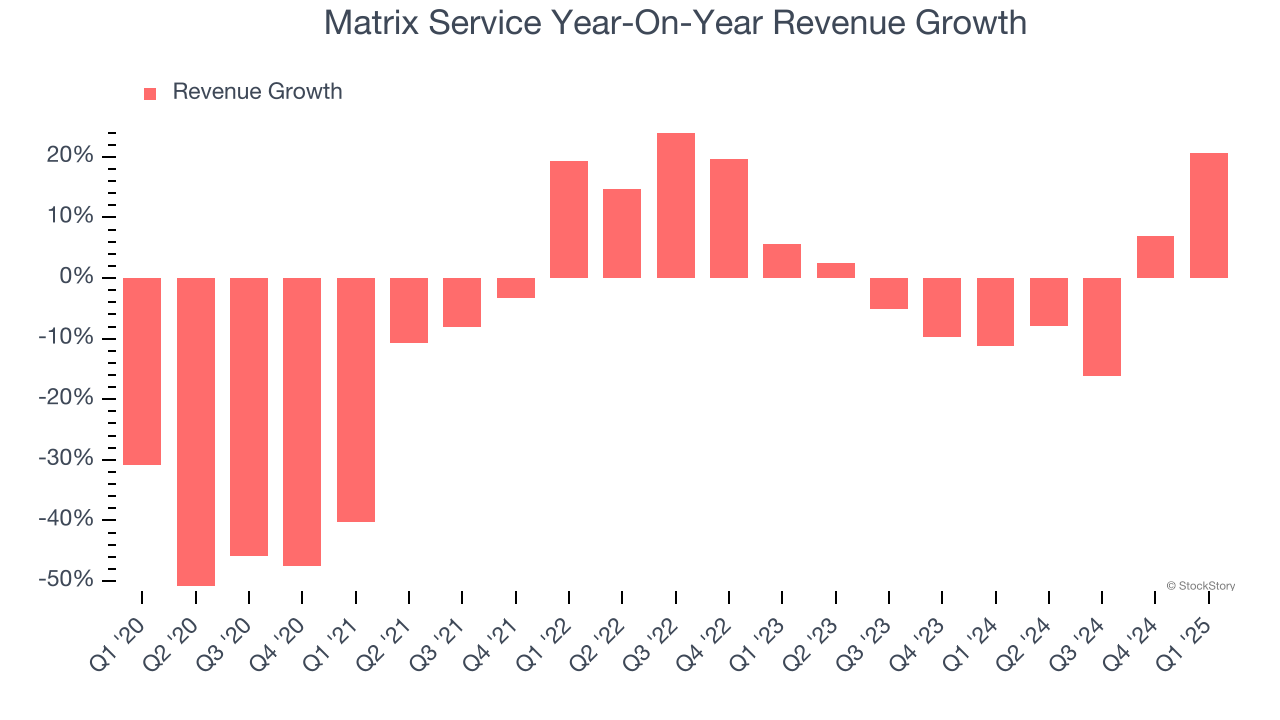
This quarter, Matrix Service generated an excellent 20.6% year-on-year revenue growth rate, but its $200.2 million of revenue fell short of Wall Street’s high expectations.
Looking ahead, sell-side analysts expect revenue to grow 28.9% over the next 12 months, an improvement versus the last two years. This projection is eye-popping and suggests its newer products and services will spur better top-line performance.
Today’s young investors won’t have read the timeless lessons in Gorilla Game: Picking Winners In High Technology because it was written more than 20 years ago when Microsoft and Apple were first establishing their supremacy. But if we apply the same principles, then enterprise software stocks leveraging their own generative AI capabilities may well be the Gorillas of the future. So, in that spirit, we are excited to present our Special Free Report on a profitable, fast-growing enterprise software stock that is already riding the automation wave and looking to catch the generative AI next.
Operating Margin
Operating margin is one of the best measures of profitability because it tells us how much money a company takes home after procuring and manufacturing its products, marketing and selling those products, and most importantly, keeping them relevant through research and development.
Matrix Service’s high expenses have contributed to an average operating margin of negative 5.4% over the last five years. Unprofitable industrials companies require extra attention because they could get caught swimming naked when the tide goes out. It’s hard to trust that the business can endure a full cycle.
Analyzing the trend in its profitability, Matrix Service’s operating margin might fluctuated slightly but has generally stayed the same over the last five years, meaning it will take a fundamental shift in the business model to change.
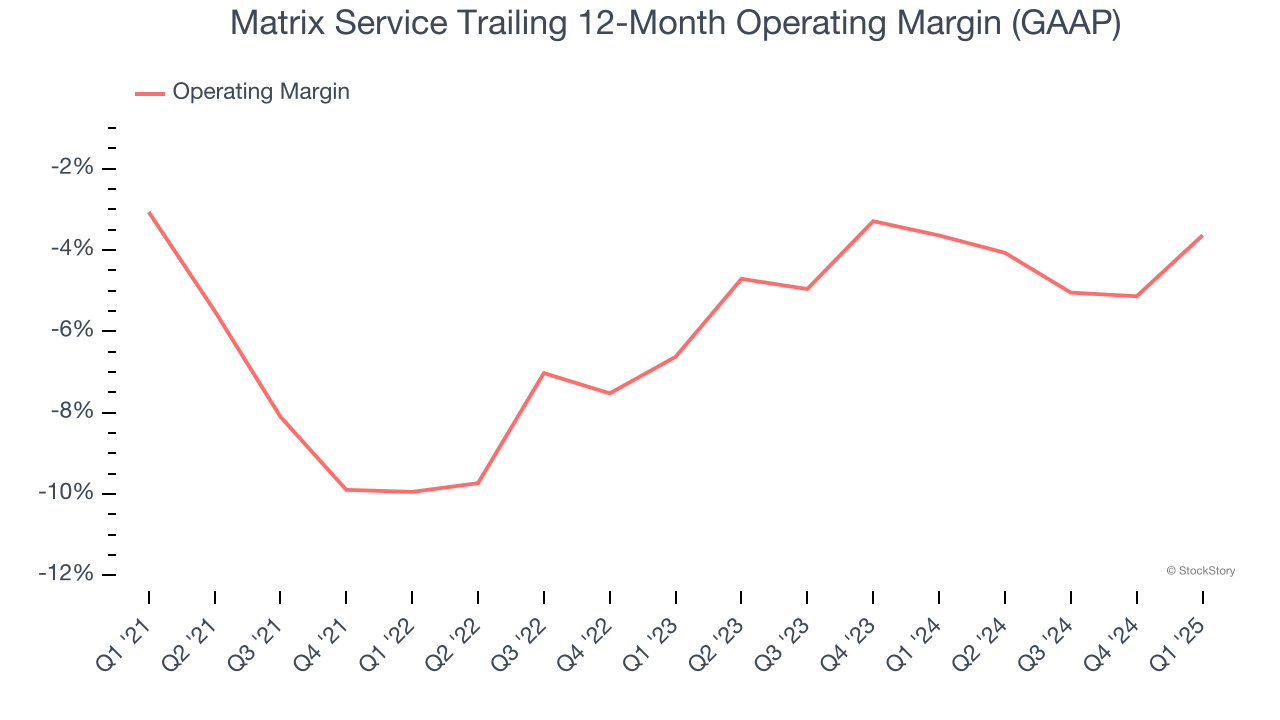
This quarter, Matrix Service generated a negative 2.5% operating margin. The company's consistent lack of profits raise a flag.
Earnings Per Share
We track the long-term change in earnings per share (EPS) for the same reason as long-term revenue growth. Compared to revenue, however, EPS highlights whether a company’s growth is profitable.
Sadly for Matrix Service, its EPS declined by 23.9% annually over the last five years, more than its revenue. This tells us the company struggled because its fixed cost base made it difficult to adjust to shrinking demand.
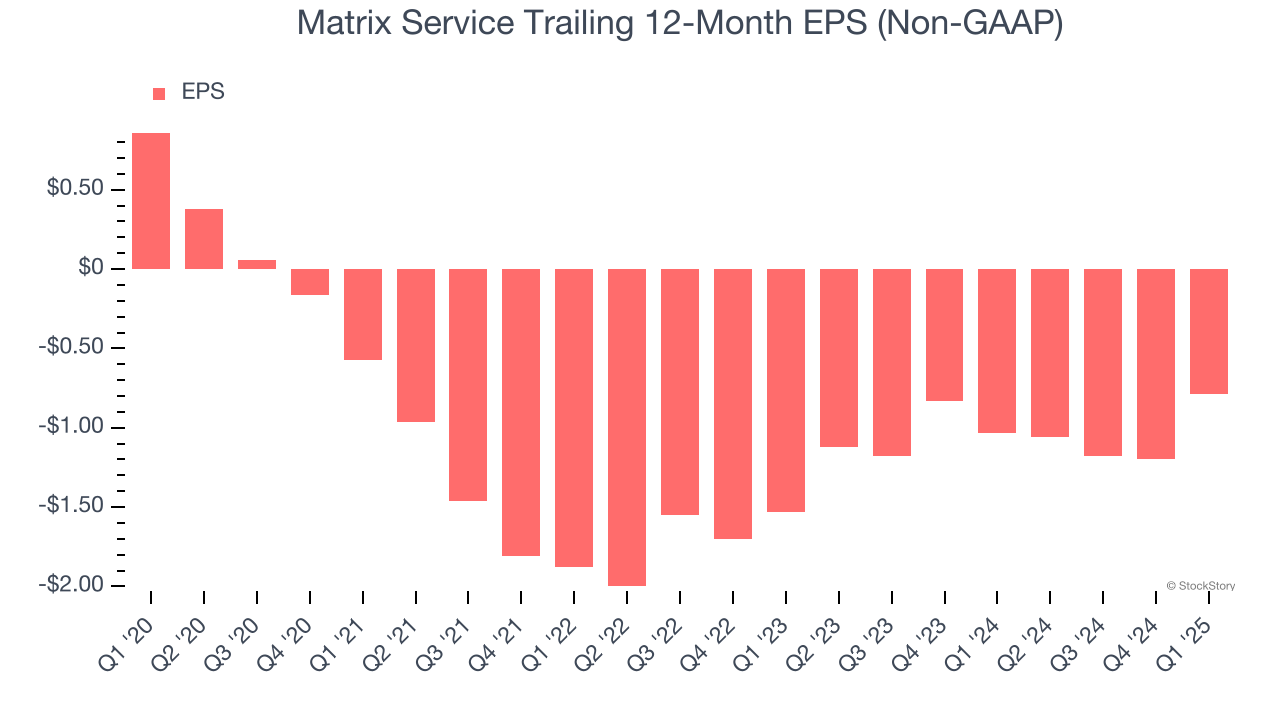
Diving into the nuances of Matrix Service’s earnings can give us a better understanding of its performance. A five-year view shows Matrix Service has diluted its shareholders, growing its share count by 5.1%. This has led to lower per share earnings. Taxes and interest expenses can also affect EPS but don’t tell us as much about a company’s fundamentals. 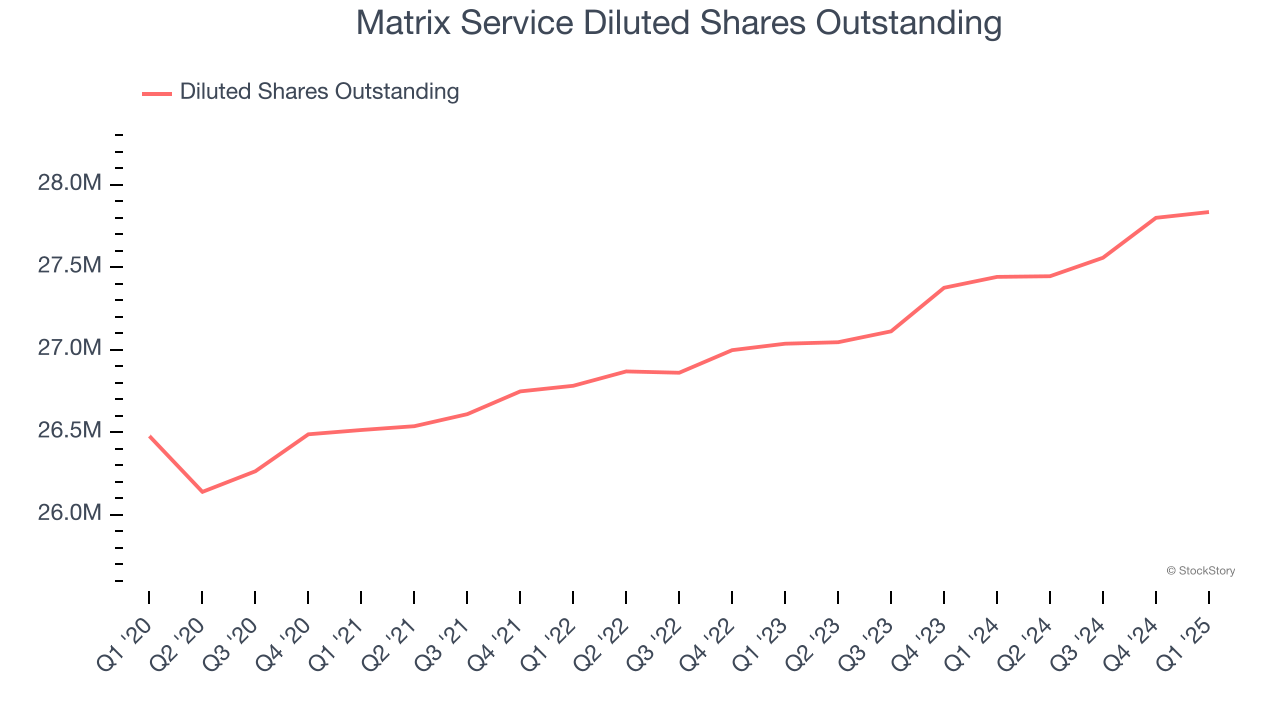
Like with revenue, we analyze EPS over a more recent period because it can provide insight into an emerging theme or development for the business.
For Matrix Service, its two-year annual EPS growth of 28.1% was higher than its five-year trend. Its improving earnings is an encouraging data point, but a caveat is that its EPS is still in the red.
In Q1, Matrix Service reported EPS at negative $0.12, up from negative $0.53 in the same quarter last year. Despite growing year on year, this print missed analysts’ estimates. Over the next 12 months, Wall Street is optimistic. Analysts forecast Matrix Service’s full-year EPS of negative $0.79 will flip to positive $0.76.
Key Takeaways from Matrix Service’s Q1 Results
We struggled to find many positives in these results. Its full-year revenue guidance missed significantly and its revenue fell short of Wall Street’s estimates. Overall, this was a softer quarter. The stock remained flat at $12.26 immediately after reporting.
Should you buy the stock or not? When making that decision, it’s important to consider its valuation, business qualities, as well as what has happened in the latest quarter. We cover that in our actionable full research report which you can read here, it’s free.