Optical retailer National Vision (NYSE: EYE) beat Wall Street’s revenue expectations in Q1 CY2025, with sales up 5.7% year on year to $510.3 million. The company’s full-year revenue guidance of $1.94 billion at the midpoint came in 0.7% above analysts’ estimates. Its non-GAAP profit of $0.34 per share was 10.5% above analysts’ consensus estimates.
Is now the time to buy National Vision? Find out by accessing our full research report, it’s free.
National Vision (EYE) Q1 CY2025 Highlights:
- Revenue: $510.3 million vs analyst estimates of $502.6 million (5.7% year-on-year growth, 1.5% beat)
- Adjusted EPS: $0.34 vs analyst estimates of $0.31 (10.5% beat)
- Adjusted EBITDA: $64.07 million vs analyst estimates of $60.83 million (12.6% margin, 5.3% beat)
- The company slightly lifted its revenue guidance for the full year to $1.94 billion at the midpoint from $1.93 billion
- Management raised its full-year Adjusted EPS guidance to $0.63 at the midpoint, a 8.6% increase
- Operating Margin: 5.1%, in line with the same quarter last year
- Free Cash Flow Margin: 2.4%, up from 0.8% in the same quarter last year
- Locations: 1,237 at quarter end, up from 1,201 in the same quarter last year
- Same-Store Sales rose 4.1% year on year (0.4% in the same quarter last year)
- Market Capitalization: $1.05 billion
“Our first quarter results are a testament to the entire team’s disciplined execution against the new strategic approach our leadership team began to implement last quarter,” said Reade Fahs, National Vision’s CEO.
Company Overview
Operating under multiple brands, National Vision (NYSE: EYE) sells optical products such as eyeglasses and provides optical services such as eye exams.
Sales Growth
A company’s long-term sales performance can indicate its overall quality. Any business can put up a good quarter or two, but the best consistently grow over the long haul.
With $1.85 billion in revenue over the past 12 months, National Vision is a small retailer, which sometimes brings disadvantages compared to larger competitors benefiting from economies of scale and negotiating leverage with suppliers.
As you can see below, National Vision grew its sales at a sluggish 2.6% compounded annual growth rate over the last six years (we compare to 2019 to normalize for COVID-19 impacts) as it closed stores.
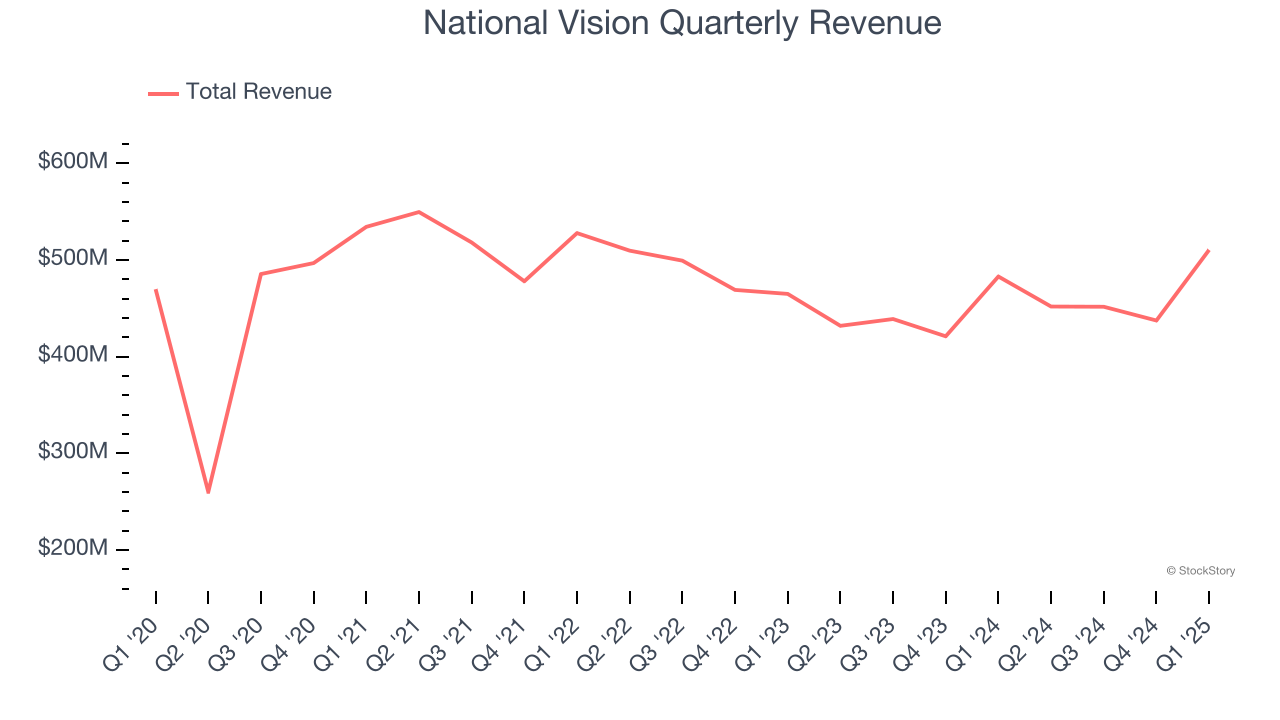
This quarter, National Vision reported year-on-year revenue growth of 5.7%, and its $510.3 million of revenue exceeded Wall Street’s estimates by 1.5%.
Looking ahead, sell-side analysts expect revenue to grow 5.1% over the next 12 months, an acceleration versus the last six years. This projection is noteworthy and implies its newer products will fuel better top-line performance.
Software is eating the world and there is virtually no industry left that has been untouched by it. That drives increasing demand for tools helping software developers do their jobs, whether it be monitoring critical cloud infrastructure, integrating audio and video functionality, or ensuring smooth content streaming. Click here to access a free report on our 3 favorite stocks to play this generational megatrend.
Store Performance
Number of Stores
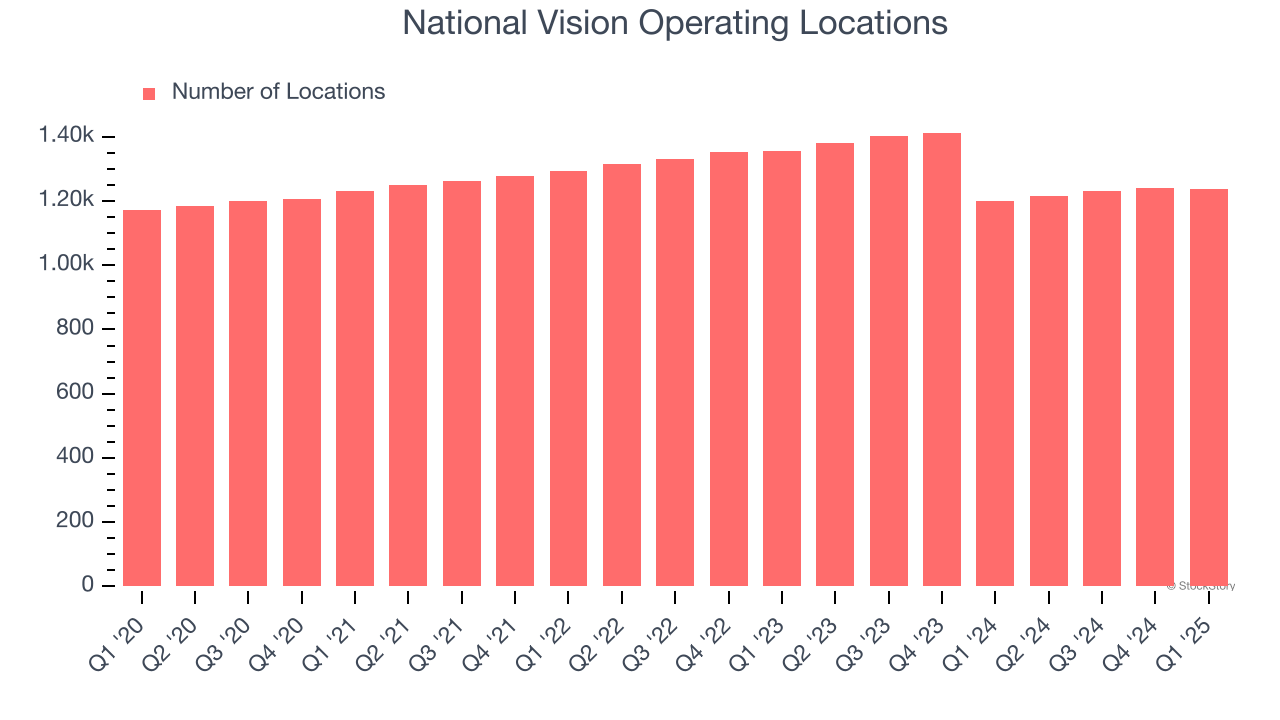
A retailer’s store count often determines how much revenue it can generate.
National Vision operated 1,237 locations in the latest quarter. Over the last two years, the company has generally closed its stores, averaging 3.8% annual declines.
When a retailer shutters stores, it usually means that brick-and-mortar demand is less than supply, and it is responding by closing underperforming locations to improve profitability.
Same-Store Sales
The change in a company's store base only tells one side of the story. The other is the performance of its existing locations and e-commerce sales, which informs management teams whether they should expand or downsize their physical footprints. Same-store sales is an industry measure of whether revenue is growing at those existing stores and is driven by customer visits (often called traffic) and the average spending per customer (ticket).
National Vision’s demand has been healthy for a retailer over the last two years. On average, the company has grown its same-store sales by a robust 2.7% per year. Given its declining store base over the same period, this performance stems from a mixture of higher e-commerce sales and increased foot traffic at existing locations (closing stores can sometimes boost same-store sales).
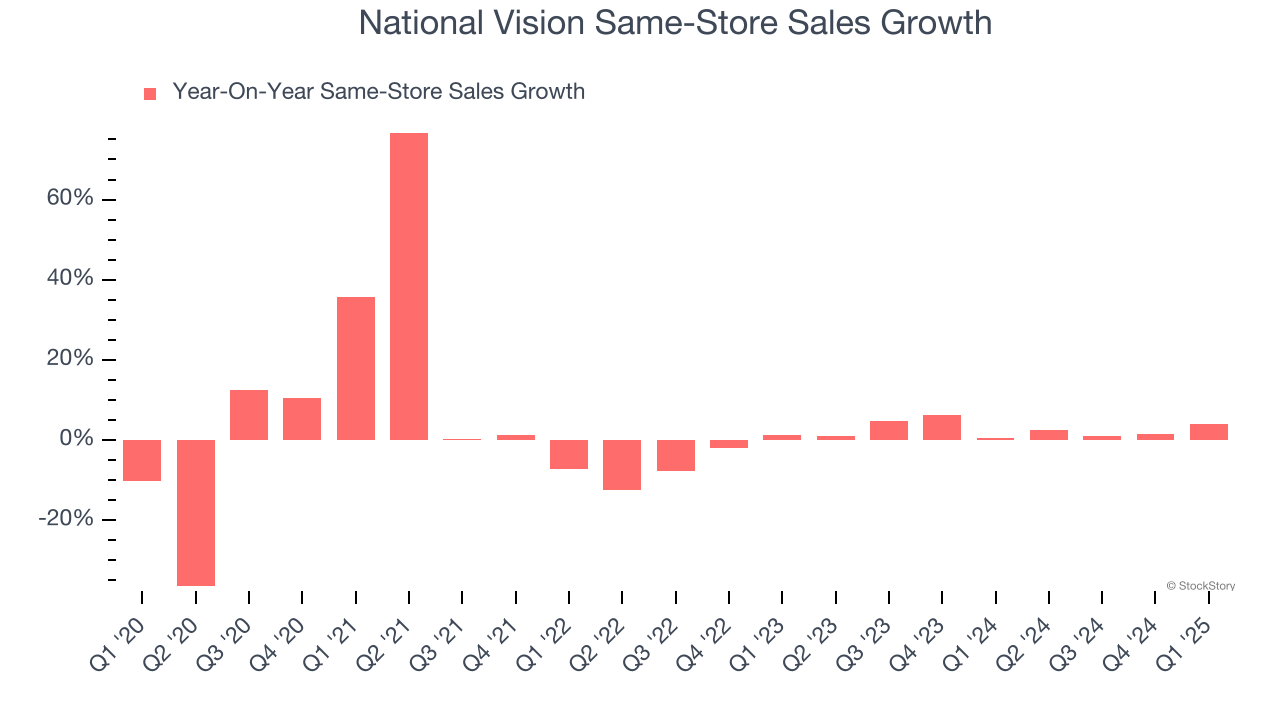
In the latest quarter, National Vision’s same-store sales rose 4.1% year on year. This growth was an acceleration from its historical levels, which is always an encouraging sign.
Key Takeaways from National Vision’s Q1 Results
We were impressed by National Vision’s optimistic full-year EPS guidance, which blew past analysts’ expectations. We were also glad its EBITDA outperformed Wall Street’s estimates. Zooming out, we think this quarter featured some important positives. The stock remained flat at $13.33 immediately after reporting.
Should you buy the stock or not? We think that the latest quarter is only one piece of the longer-term business quality puzzle. Quality, when combined with valuation, can help determine if the stock is a buy. We cover that in our actionable full research report which you can read here, it’s free.