
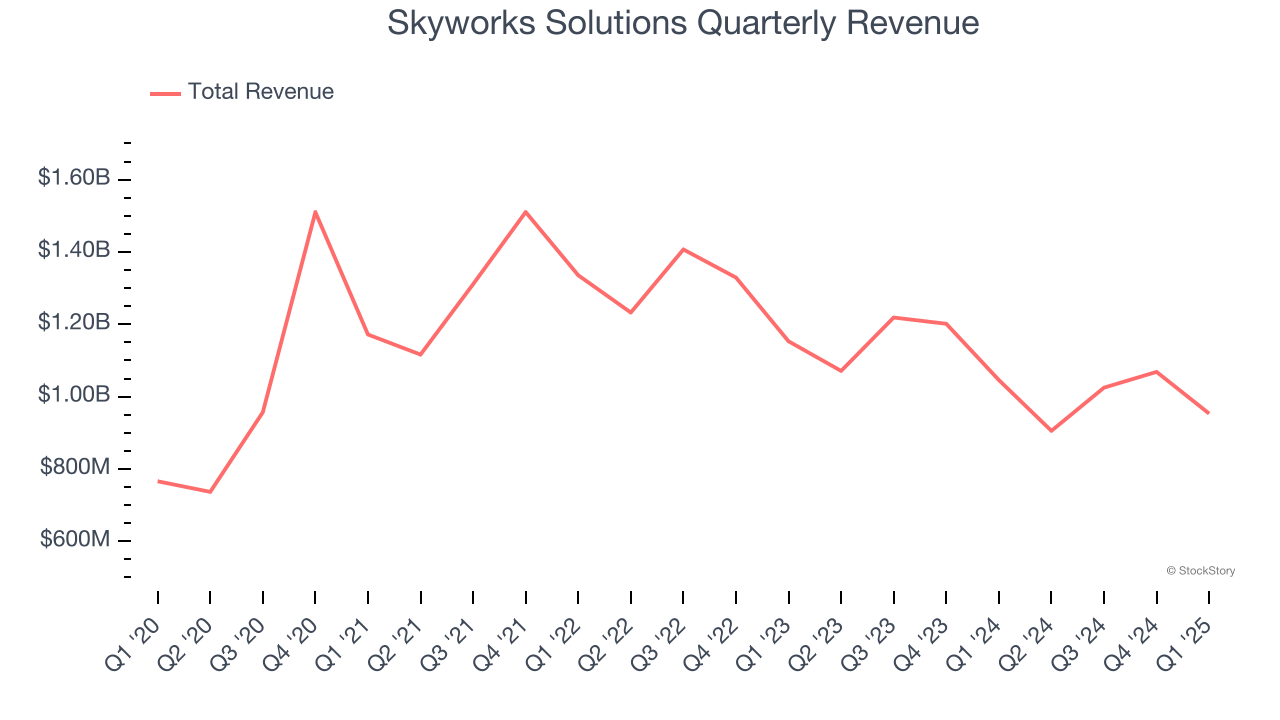
Wireless chips maker Skyworks Solutions (NASDAQ: SWKS) met Wall Street’s revenue expectations in Q1 CY2025, but sales fell by 8.9% year on year to $953.2 million. The company expects next quarter’s revenue to be around $940 million, coming in 2.8% above analysts’ estimates. Its non-GAAP profit of $1.24 per share was 3.1% above analysts’ consensus estimates.
Is now the time to buy Skyworks Solutions? Find out by accessing our full research report, it’s free.
Skyworks Solutions (SWKS) Q1 CY2025 Highlights:
- Revenue: $953.2 million vs analyst estimates of $952.9 million (8.9% year-on-year decline, in line)
- Adjusted EPS: $1.24 vs analyst estimates of $1.20 (3.1% beat)
- Adjusted Operating Income: $222.2 million vs analyst estimates of $211.5 million (23.3% margin, 5.1% beat)
- Revenue Guidance for Q2 CY2025 is $940 million at the midpoint, above analyst estimates of $914.4 million
- Adjusted EPS guidance for Q2 CY2025 is $1.24 at the midpoint, above analyst estimates of $1.05
- Operating Margin: 10.2%, down from 18.1% in the same quarter last year
- Free Cash Flow Margin: 38.9%, up from 26.1% in the same quarter last year
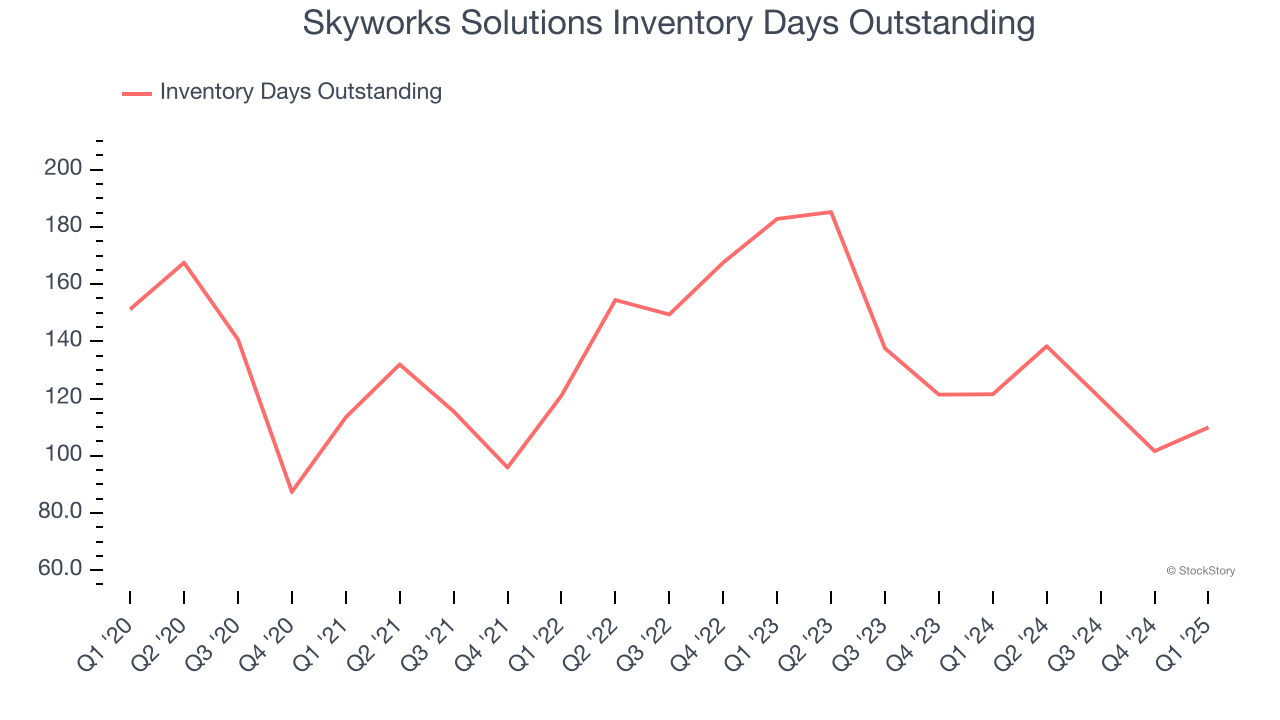
- Inventory Days Outstanding: 110, up from 102 in the previous quarter
- Market Capitalization: $10.14 billion
Company Overview
Result of a merger of Alpha Industries and the wireless communications division of Conexant, Skyworks Solutions (NASDAQ: SWKS) is a designer and manufacturer of chips used in smartphones, autos, and industrial applications to amplify, filter, and process wireless signals.
Sales Growth
Reviewing a company’s long-term sales performance reveals insights into its quality. Any business can have short-term success, but a top-tier one grows for years. Regrettably, Skyworks Solutions’s sales grew at a sluggish 3.9% compounded annual growth rate over the last five years. This fell short of our benchmark for the semiconductor sector and is a poor baseline for our analysis. Semiconductors are a cyclical industry, and long-term investors should be prepared for periods of high growth followed by periods of revenue contractions.
We at StockStory place the most emphasis on long-term growth, but within semiconductors, a half-decade historical view may miss new demand cycles or industry trends like AI. Skyworks Solutions’s performance shows it grew in the past but relinquished its gains over the last two years, as its revenue fell by 12.2% annually. 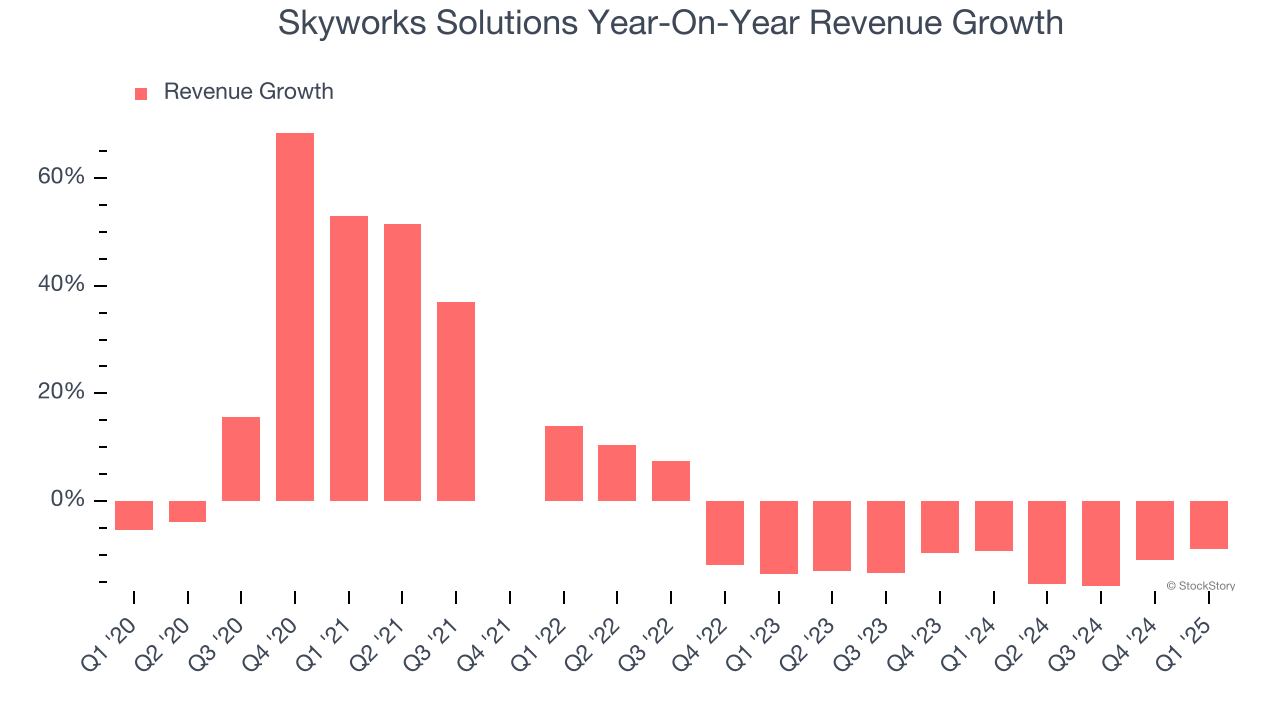
This quarter, Skyworks Solutions reported a rather uninspiring 8.9% year-on-year revenue decline to $953.2 million of revenue, in line with Wall Street’s estimates. Despite meeting estimates, the drop in sales could mean that the current downcycle is deepening. Company management is currently guiding for a 3.8% year-on-year increase in sales next quarter.
Looking further ahead, sell-side analysts expect revenue to decline by 9.1% over the next 12 months. While this projection is better than its two-year trend, it's tough to feel optimistic about a company facing demand difficulties.
Unless you’ve been living under a rock, it should be obvious by now that generative AI is going to have a huge impact on how large corporations do business. While Nvidia and AMD are trading close to all-time highs, we prefer a lesser-known (but still profitable) stock benefiting from the rise of AI. Click here to access our free report one of our favorites growth stories.
Product Demand & Outstanding Inventory
Days Inventory Outstanding (DIO) is an important metric for chipmakers, as it reflects a business’ capital intensity and the cyclical nature of semiconductor supply and demand. In a tight supply environment, inventories tend to be stable, allowing chipmakers to exert pricing power. Steadily increasing DIO can be a warning sign that demand is weak, and if inventories continue to rise, the company may have to downsize production.
This quarter, Skyworks Solutions’s DIO came in at 110, which is 23 days below its five-year average. These numbers show that despite the recent increase, there’s no indication of an excessive inventory buildup.
Key Takeaways from Skyworks Solutions’s Q1 Results
We enjoyed seeing Skyworks Solutions beat analysts’ adjusted operating income expectations this quarter. We were also glad its revenue guidance for next quarter exceeded Wall Street’s estimates. On the other hand, its inventory levels materially increased. Overall, this print had some key positives. The stock traded up 2.4% to $68.50 immediately after reporting.
Skyworks Solutions may have had a good quarter, but does that mean you should invest right now? The latest quarter does matter, but not nearly as much as longer-term fundamentals and valuation, when deciding if the stock is a buy. We cover that in our actionable full research report which you can read here, it’s free.