
Smart home company SmartRent (NYSE: SMRT) reported Q1 CY2025 results topping the market’s revenue expectations, but sales fell by 18.1% year on year to $41.34 million. Its non-GAAP loss of $0.21 per share was significantly below analysts’ consensus estimates.
Is now the time to buy SmartRent? Find out by accessing our full research report, it’s free.
SmartRent (SMRT) Q1 CY2025 Highlights:
- Revenue: $41.34 million vs analyst estimates of $40.08 million (18.1% year-on-year decline, 3.1% beat)
- Adjusted EPS: -$0.21 vs analyst estimates of -$0.01 (significant miss)
- Adjusted EBITDA: -$6.37 million vs analyst estimates of -$4.57 million (-15.4% margin, 39.4% miss)
- Operating Margin: -99.9%, down from -20.1% in the same quarter last year
- Free Cash Flow was -$15.64 million compared to -$3.37 million in the same quarter last year
- Annual Recurring Revenue: $55.9 million at quarter end, up 17.4% year on year
- Market Capitalization: $173.3 million
John Dorman, SmartRent's Interim Chief Executive Officer, commented, "We have taken foundational steps to rebuild SmartRent as a more customer-centric, execution-driven organization. While our adoption pace has not yet matched the scale of our installed base, we are actively retooling our operations to better align with how customers adopt, deploy and expand our solutions. This work is central to our shift toward a hardware-enabled SaaS model that prioritizes recurring revenue, customer value, and long-term profitable growth."
Company Overview
Founded by an employee at a real estate rental company, SmartRent (NYSE: SMRT) provides smart home devices and software for multifamily residential properties, single-family rental homes, and student housing communities.
Sales Growth
A company’s long-term sales performance can indicate its overall quality. Any business can put up a good quarter or two, but the best consistently grow over the long haul. Over the last four years, SmartRent grew its sales at an incredible 31.7% compounded annual growth rate. Its growth beat the average industrials company and shows its offerings resonate with customers, a helpful starting point for our analysis.
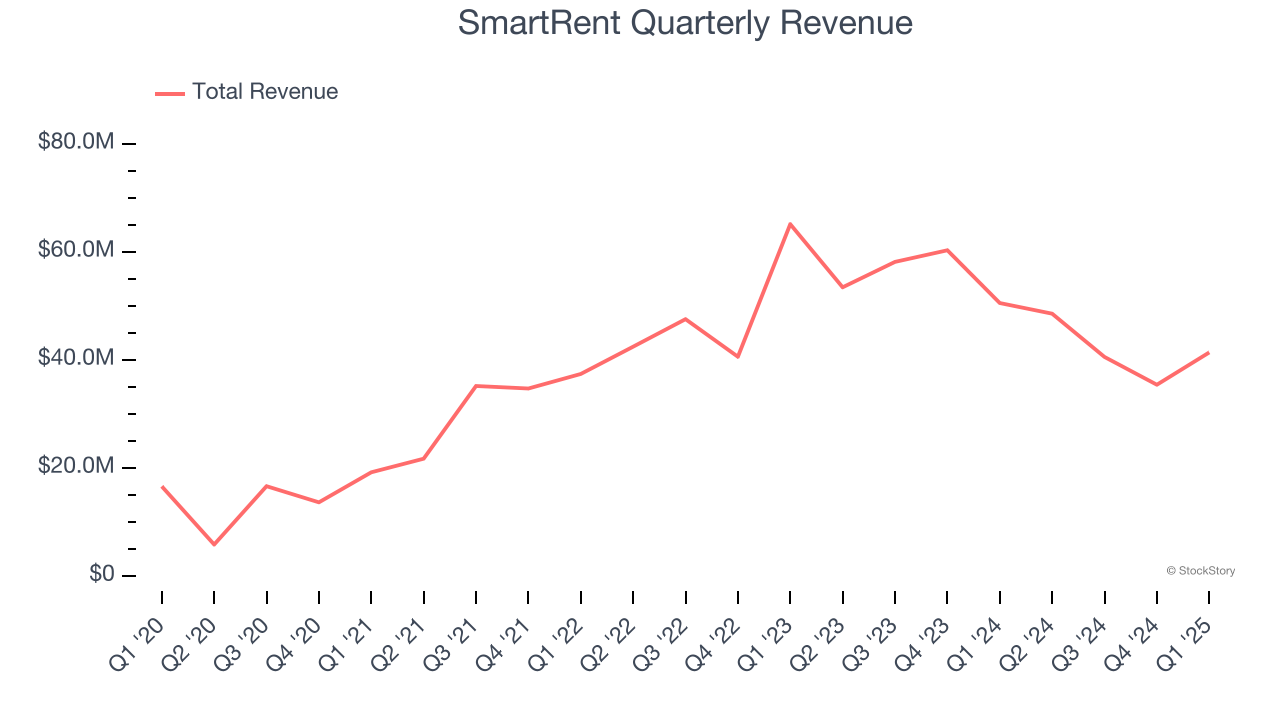
Long-term growth is the most important, but within industrials, a stretched historical view may miss new industry trends or demand cycles. SmartRent’s recent performance marks a sharp pivot from its four-year trend as its revenue has shown annualized declines of 7.9% over the last two years. SmartRent isn’t alone in its struggles as the Internet of Things industry experienced a cyclical downturn, with many similar businesses observing lower sales at this time. 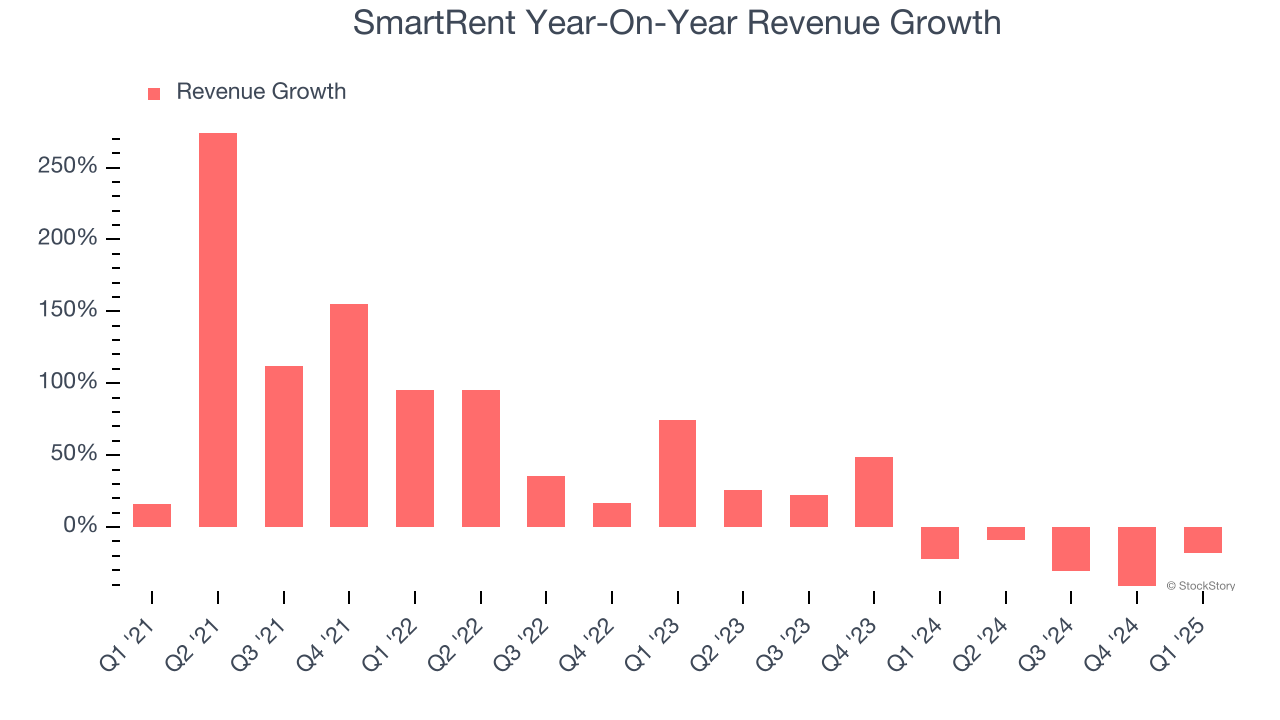
SmartRent also reports its annual recurring revenue (ARR), or the revenue it expects to generate from its existing customer base in the next 12 months. SmartRent’s ARR reached $55.9 million in the latest quarter and averaged 28.5% year-on-year growth over the last two years. Because this performance is better than its normal revenue growth, we can see the company generated more revenue from its existing customers than new customers. Holding everything else constant, this is a positive sign as it should lead to lower sales and marketing expenses. 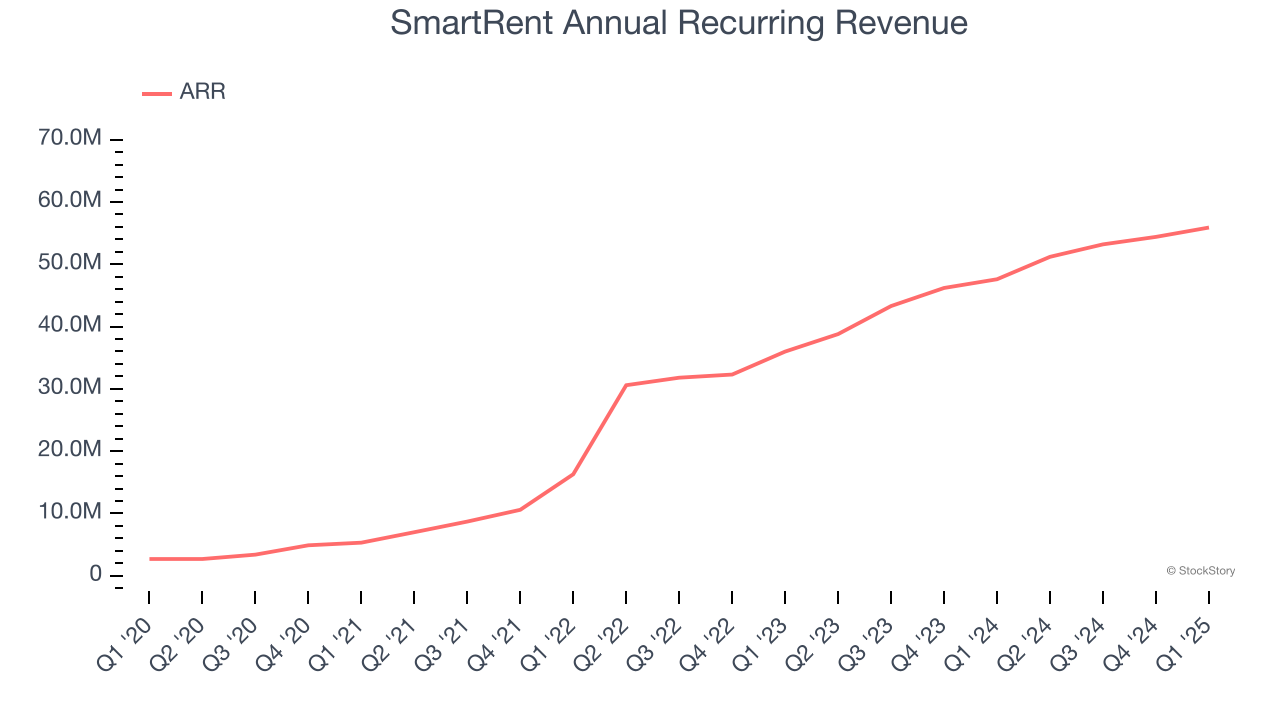
This quarter, SmartRent’s revenue fell by 18.1% year on year to $41.34 million but beat Wall Street’s estimates by 3.1%.
Looking ahead, sell-side analysts expect revenue to grow 26.3% over the next 12 months, an improvement versus the last two years. This projection is eye-popping and suggests its newer products and services will spur better top-line performance.
Software is eating the world and there is virtually no industry left that has been untouched by it. That drives increasing demand for tools helping software developers do their jobs, whether it be monitoring critical cloud infrastructure, integrating audio and video functionality, or ensuring smooth content streaming. Click here to access a free report on our 3 favorite stocks to play this generational megatrend.
Operating Margin
SmartRent’s high expenses have contributed to an average operating margin of negative 43.1% over the last five years. Unprofitable industrials companies require extra attention because they could get caught swimming naked when the tide goes out.
On the plus side, SmartRent’s operating margin rose by 25.3 percentage points over the last five years, as its sales growth gave it operating leverage. Still, it will take much more for the company to reach long-term profitability.
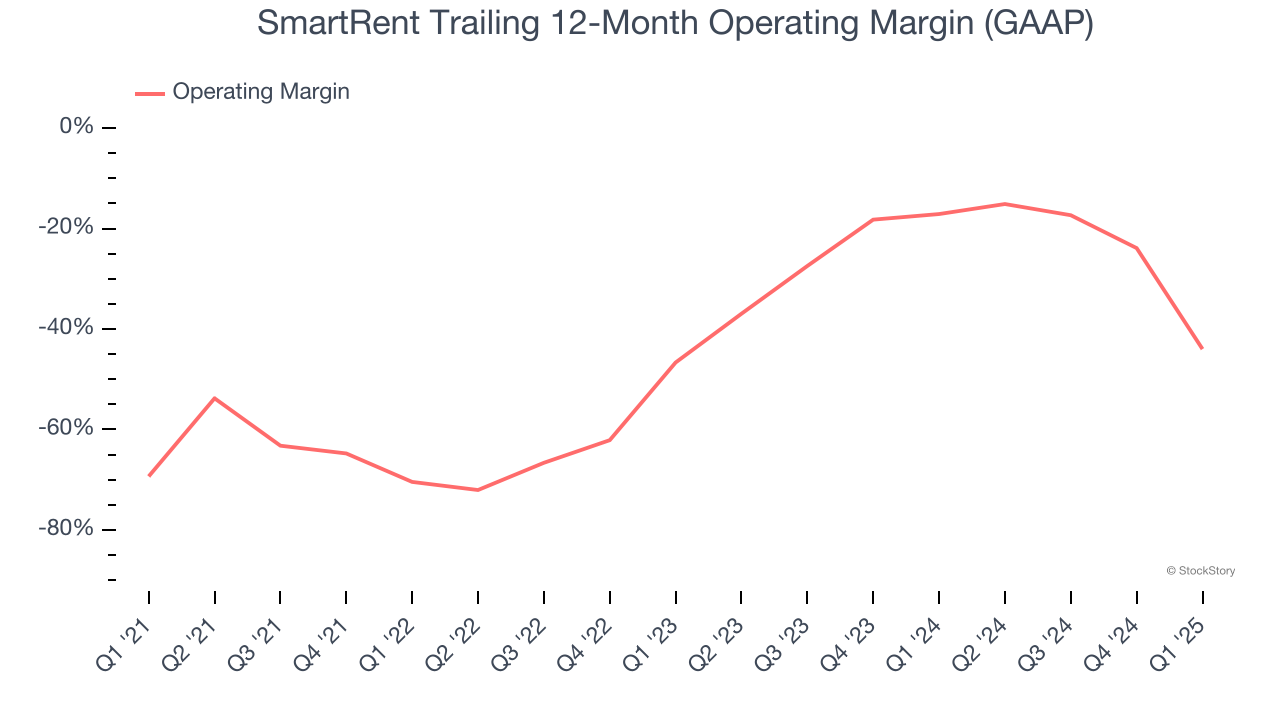
This quarter, SmartRent generated a negative 99.9% operating margin.
Earnings Per Share
We track the long-term change in earnings per share (EPS) for the same reason as long-term revenue growth. Compared to revenue, however, EPS highlights whether a company’s growth is profitable.
Although SmartRent’s full-year earnings are still negative, it reduced its losses and improved its EPS by 61.5% annually over the last four years. The next few quarters will be critical for assessing its long-term profitability. We hope to see an inflection point soon.
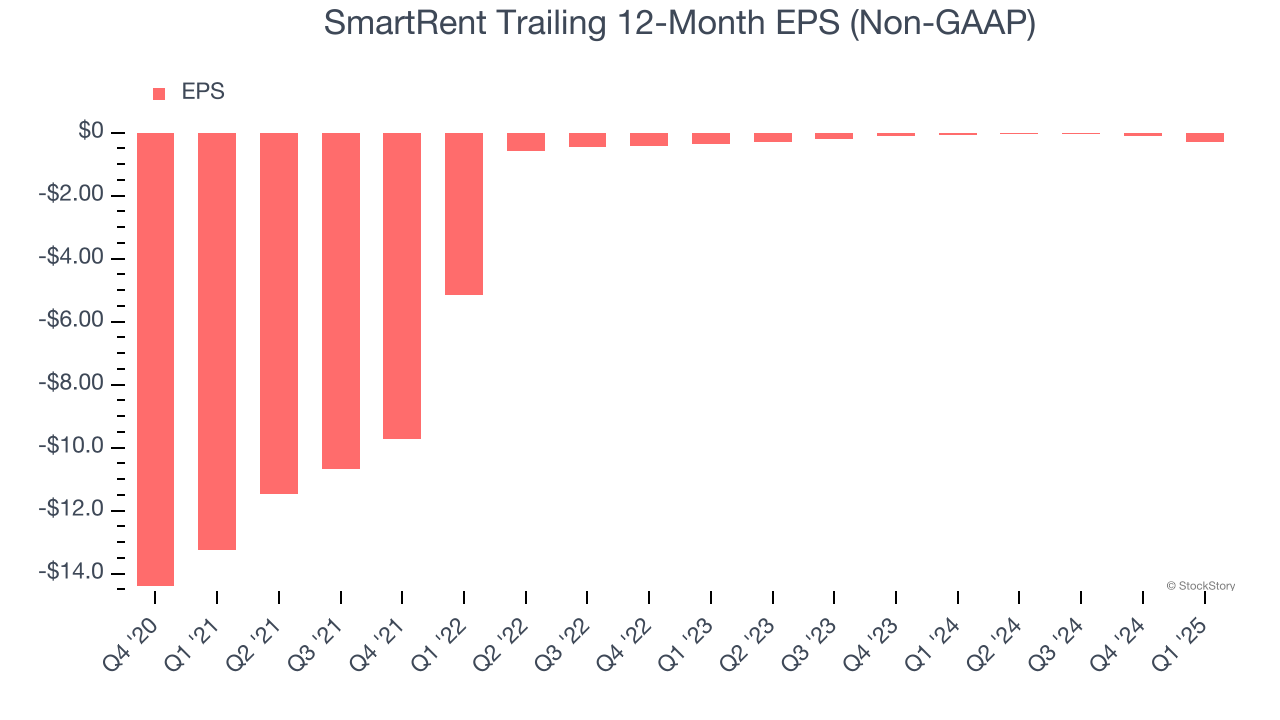
Like with revenue, we analyze EPS over a shorter period to see if we are missing a change in the business.
For SmartRent, its two-year annual EPS growth of 11.5% was lower than its four-year trend. We still think its growth was good and hope it can accelerate in the future.
In Q1, SmartRent reported EPS at negative $0.21, down from negative $0.02 in the same quarter last year. This print missed analysts’ estimates. We also like to analyze expected EPS growth based on Wall Street analysts’ consensus projections, but there is insufficient data.
Key Takeaways from SmartRent’s Q1 Results
We enjoyed seeing SmartRent beat analysts’ revenue expectations this quarter. On the other hand, its EPS and EBITDA fell short of Wall Street’s estimates. Overall, this was a softer quarter. The stock traded down 5.4% to $0.85 immediately after reporting.
SmartRent didn’t show it’s best hand this quarter, but does that create an opportunity to buy the stock right now? The latest quarter does matter, but not nearly as much as longer-term fundamentals and valuation, when deciding if the stock is a buy. We cover that in our actionable full research report which you can read here, it’s free.