Smart security company Arlo (NYSE: ARLO) reported Q1 CY2025 results topping the market’s revenue expectations, but sales fell by 4.1% year on year to $119.1 million. Its non-GAAP profit of $0.15 per share was 28.2% above analysts’ consensus estimates.
Is now the time to buy Arlo Technologies? Find out by accessing our full research report, it’s free.
Arlo Technologies (ARLO) Q1 CY2025 Highlights:
- Revenue: $119.1 million vs analyst estimates of $118.4 million (4.1% year-on-year decline, 0.6% beat)
- Adjusted EPS: $0.15 vs analyst estimates of $0.12 (28.2% beat)
- Adjusted EBITDA: $16.42 million vs analyst estimates of $12.33 million (13.8% margin, 33.1% beat)
- Operating Margin: -1.2%, up from -8.5% in the same quarter last year
- Free Cash Flow Margin: 23.6%, up from 15.7% in the same quarter last year
- Market Capitalization: $1.08 billion
Company Overview
Originally spun off from networking equipment maker Netgear in 2018, Arlo Technologies (NYSE: ARLO) provides cloud-based smart security devices and subscription services that help consumers and businesses monitor and protect their homes, properties, and loved ones.
Sales Growth
A company’s long-term sales performance is one signal of its overall quality. Any business can put up a good quarter or two, but the best consistently grow over the long haul.
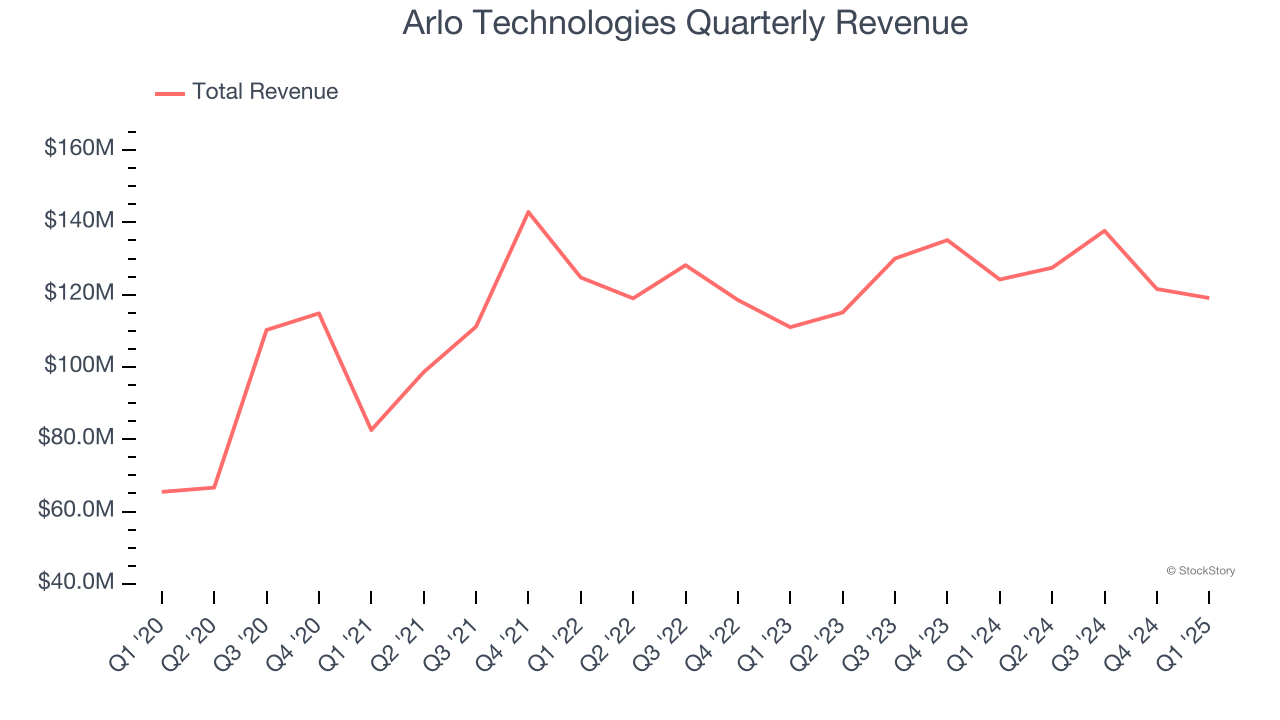
With $505.8 million in revenue over the past 12 months, Arlo Technologies is a small player in the business services space, which sometimes brings disadvantages compared to larger competitors benefiting from economies of scale and numerous distribution channels. On the bright side, it can grow faster because it has more room to expand.
As you can see below, Arlo Technologies’s 6% annualized revenue growth over the last five years was decent. This shows its offerings generated slightly more demand than the average business services company, a useful starting point for our analysis.
Long-term growth is the most important, but within business services, a half-decade historical view may miss new innovations or demand cycles. Arlo Technologies’s recent performance shows its demand has slowed as its annualized revenue growth of 3% over the last two years was below its five-year trend. 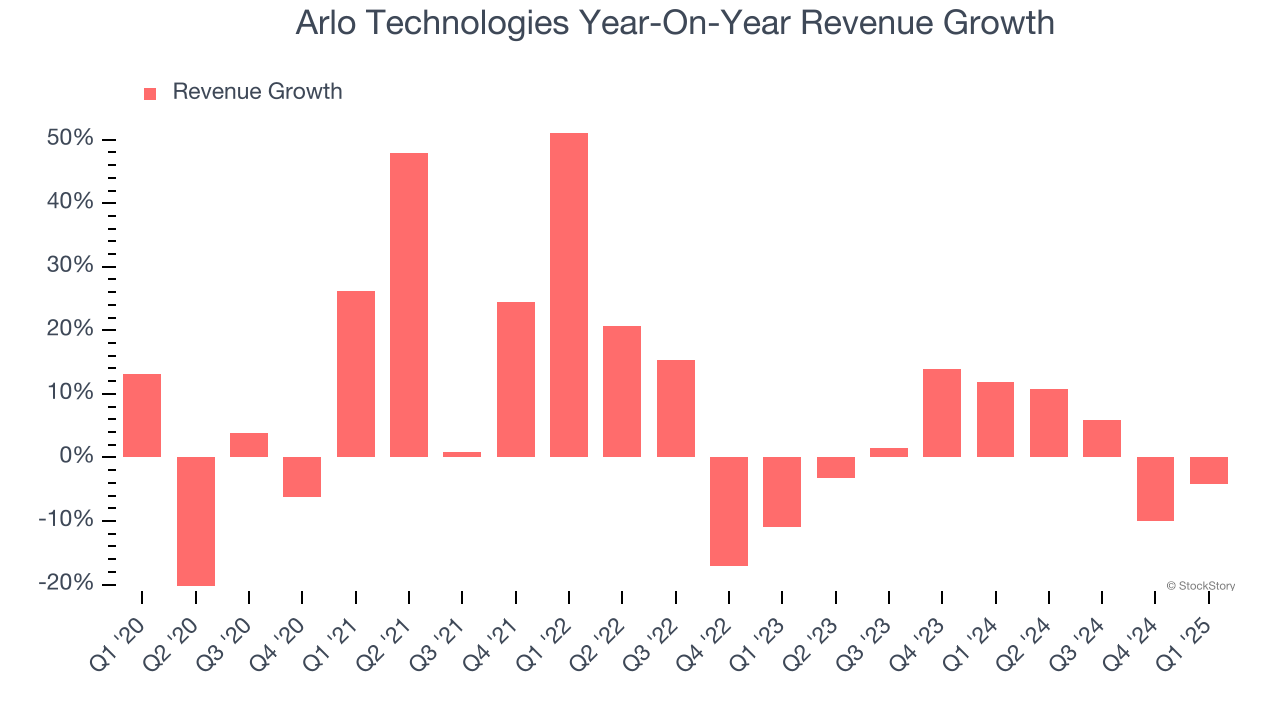
This quarter, Arlo Technologies’s revenue fell by 4.1% year on year to $119.1 million but beat Wall Street’s estimates by 0.6%.
Looking ahead, sell-side analysts expect revenue to grow 6% over the next 12 months, an improvement versus the last two years. This projection is above the sector average and suggests its newer products and services will catalyze better top-line performance.
Here at StockStory, we certainly understand the potential of thematic investing. Diverse winners from Microsoft (MSFT) to Alphabet (GOOG), Coca-Cola (KO) to Monster Beverage (MNST) could all have been identified as promising growth stories with a megatrend driving the growth. So, in that spirit, we’ve identified a relatively under-the-radar profitable growth stock benefiting from the rise of AI, available to you FREE via this link.
Operating Margin
Operating margin is an important measure of profitability as it shows the portion of revenue left after accounting for all core expenses – everything from the cost of goods sold to advertising and wages. It’s also useful for comparing profitability across companies with different levels of debt and tax rates because it excludes interest and taxes.
Arlo Technologies’s high expenses have contributed to an average operating margin of negative 9.8% over the last five years. Unprofitable business services companies require extra attention because they could get caught swimming naked when the tide goes out. It’s hard to trust that the business can endure a full cycle.
On the plus side, Arlo Technologies’s operating margin rose by 15.4 percentage points over the last five years, as its sales growth gave it operating leverage. Still, it will take much more for the company to reach long-term profitability.
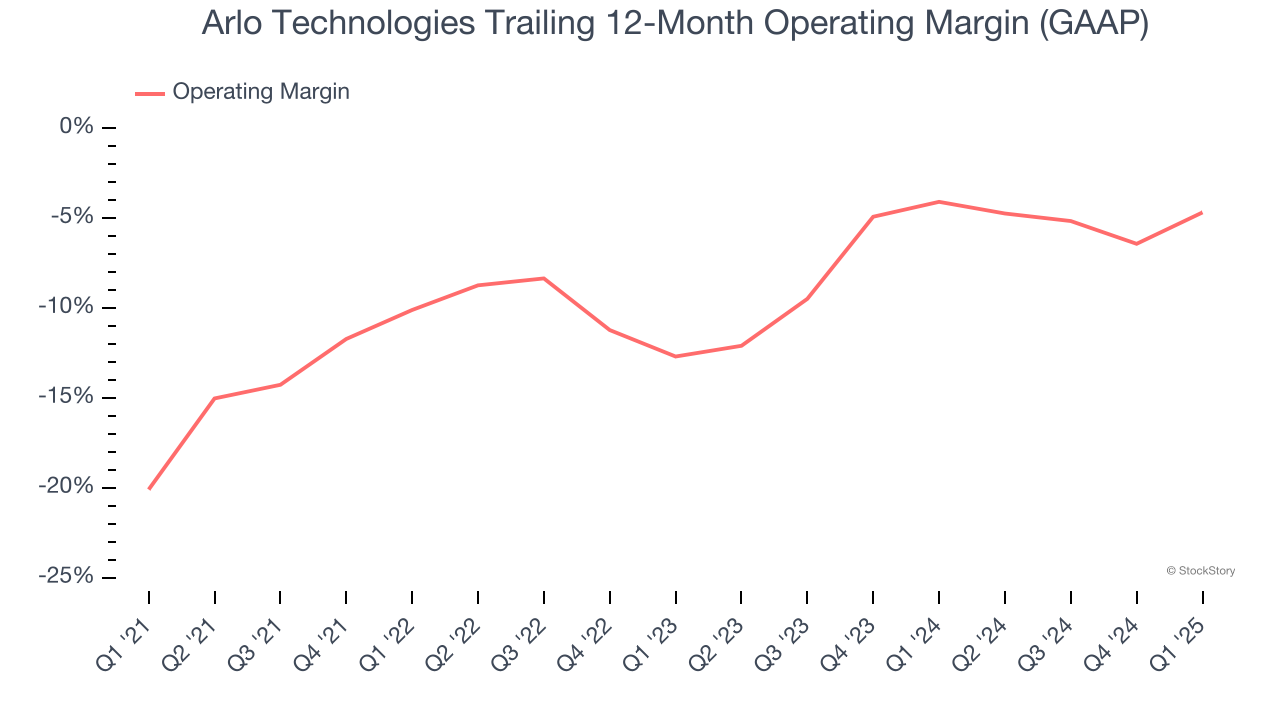
Arlo Technologies’s operating margin was negative 1.2% this quarter. The company's consistent lack of profits raise a flag.
Earnings Per Share
We track the long-term change in earnings per share (EPS) for the same reason as long-term revenue growth. Compared to revenue, however, EPS highlights whether a company’s growth is profitable.
Arlo Technologies’s full-year EPS flipped from negative to positive over the last five years. This is a good sign and shows it’s at an inflection point.
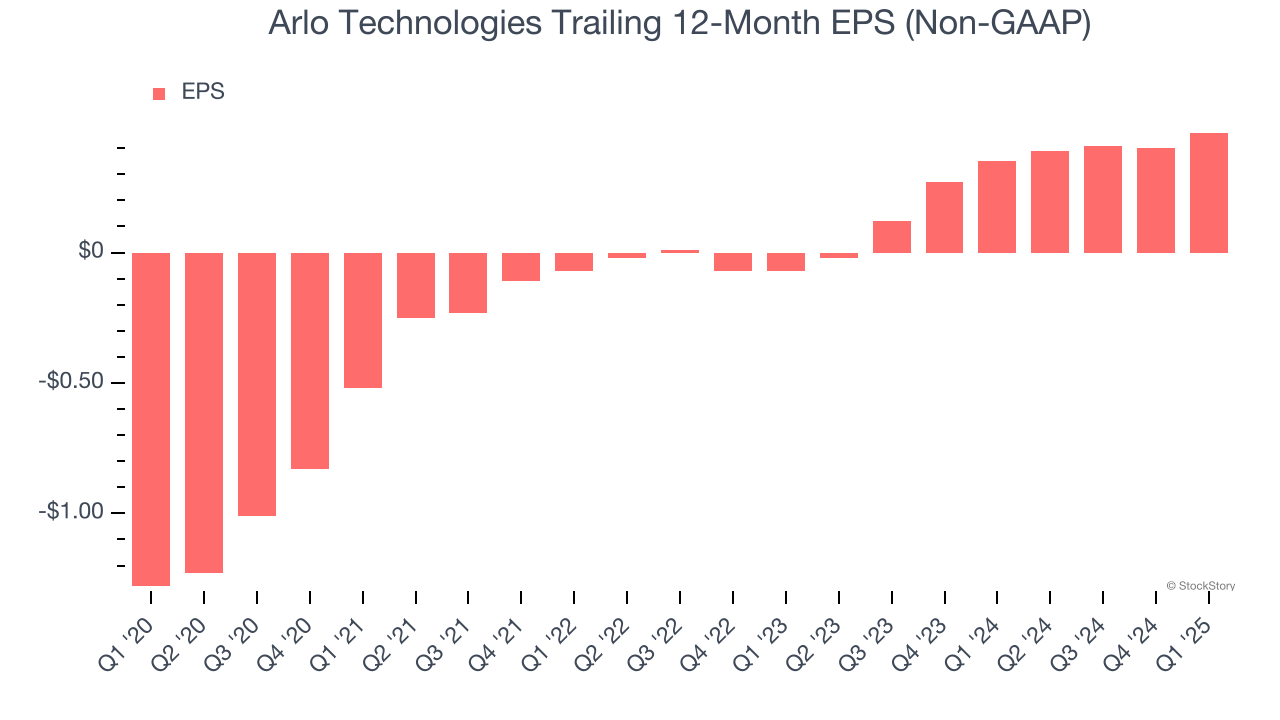
In Q1, Arlo Technologies reported EPS at $0.15, up from $0.09 in the same quarter last year. This print easily cleared analysts’ estimates, and shareholders should be content with the results. Over the next 12 months, Wall Street expects Arlo Technologies’s full-year EPS of $0.46 to grow 39.4%.
Key Takeaways from Arlo Technologies’s Q1 Results
We were impressed by how significantly Arlo Technologies blew past analysts’ EPS expectations this quarter. We were also happy its revenue narrowly outperformed Wall Street’s estimates. Zooming out, we think this quarter featured some important positives. Investors were likely hoping for more, and shares traded down 2% to $10.44 immediately after reporting.
So should you invest in Arlo Technologies right now? What happened in the latest quarter matters, but not as much as longer-term business quality and valuation, when deciding whether to invest in this stock. We cover that in our actionable full research report which you can read here, it’s free.