Online auto marketplace CarGurus (NASDAQ: CARG) met Wall Street’s revenue expectations in Q1 CY2025, with sales up 4.3% year on year to $225.2 million. The company expects next quarter’s revenue to be around $232 million, close to analysts’ estimates. Its non-GAAP profit of $0.46 per share was 5.5% above analysts’ consensus estimates.
Is now the time to buy CarGurus? Find out by accessing our full research report, it’s free.
CarGurus (CARG) Q1 CY2025 Highlights:
- Revenue: $225.2 million vs analyst estimates of $226.2 million (4.3% year-on-year growth, in line)
- Adjusted EPS: $0.46 vs analyst estimates of $0.44 (5.5% beat)
- Adjusted EBITDA: $66.3 million vs analyst estimates of $63.61 million (29.4% margin, 4.2% beat)
- Revenue Guidance for Q2 CY2025 is $232 million at the midpoint, roughly in line with what analysts were expecting
- Adjusted EPS guidance for Q2 CY2025 is $0.55 at the midpoint, above analyst estimates of $0.45
- EBITDA guidance for Q2 CY2025 is $75.5 million at the midpoint, above analyst estimates of $65.68 million
- Operating Margin: 20.3%, up from 12.2% in the same quarter last year
- Free Cash Flow Margin: 26.8%, similar to the previous quarter
- Paying Dealers: 32,372, up 1,197 year on year
- Market Capitalization: $2.80 billion
"Our strong momentum in our Marketplace business continued into 2025, which grew 13% year-over-year,” said Jason Trevisan, Chief Executive Officer at CarGurus.
Company Overview
Bringing transparency to a sometimes opaque process, CarGurus (NASDAQ: CARG) is a digital marketplace where auto dealers can connect with potential customers and where car buyers can browse, purchase, and obtain financing.
Sales Growth
Reviewing a company’s long-term sales performance reveals insights into its quality. Any business can put up a good quarter or two, but many enduring ones grow for years. CarGurus struggled to consistently generate demand over the last three years as its sales dropped at a 9.3% annual rate. This wasn’t a great result and is a poor baseline for our analysis.
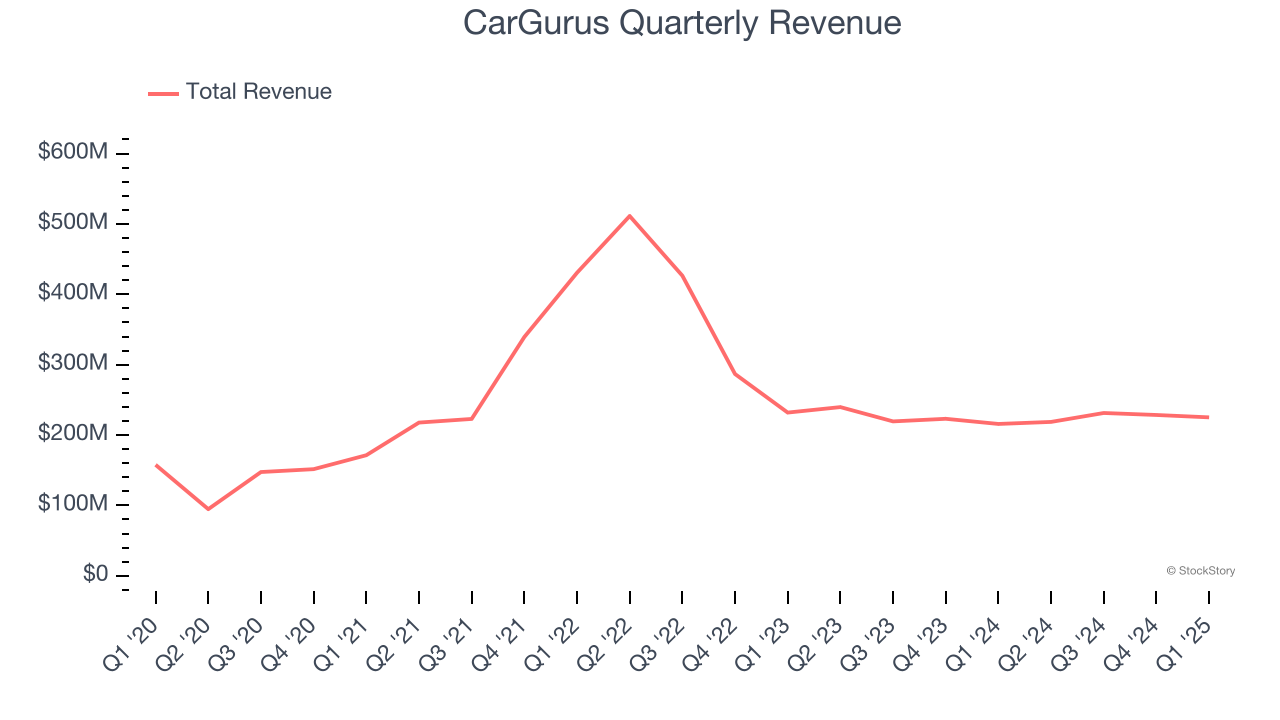
This quarter, CarGurus grew its revenue by 4.3% year on year, and its $225.2 million of revenue was in line with Wall Street’s estimates. Company management is currently guiding for a 6.1% year-on-year increase in sales next quarter.
Looking further ahead, sell-side analysts expect revenue to grow 6.2% over the next 12 months. Although this projection implies its newer products and services will catalyze better top-line performance, it is still below the sector average.
Here at StockStory, we certainly understand the potential of thematic investing. Diverse winners from Microsoft (MSFT) to Alphabet (GOOG), Coca-Cola (KO) to Monster Beverage (MNST) could all have been identified as promising growth stories with a megatrend driving the growth. So, in that spirit, we’ve identified a relatively under-the-radar profitable growth stock benefiting from the rise of AI, available to you FREE via this link.
Paying Dealers
User Growth
As an online marketplace, CarGurus generates revenue growth by increasing both the number of users on its platform and the average order size in dollars.
CarGurus struggled with new customer acquisition over the last two years as its paying dealers were flat at 32,372. This performance isn't ideal because internet usage is secular, meaning there are typically unaddressed market opportunities. If CarGurus wants to accelerate growth, it likely needs to enhance the appeal of its current offerings or innovate with new products. 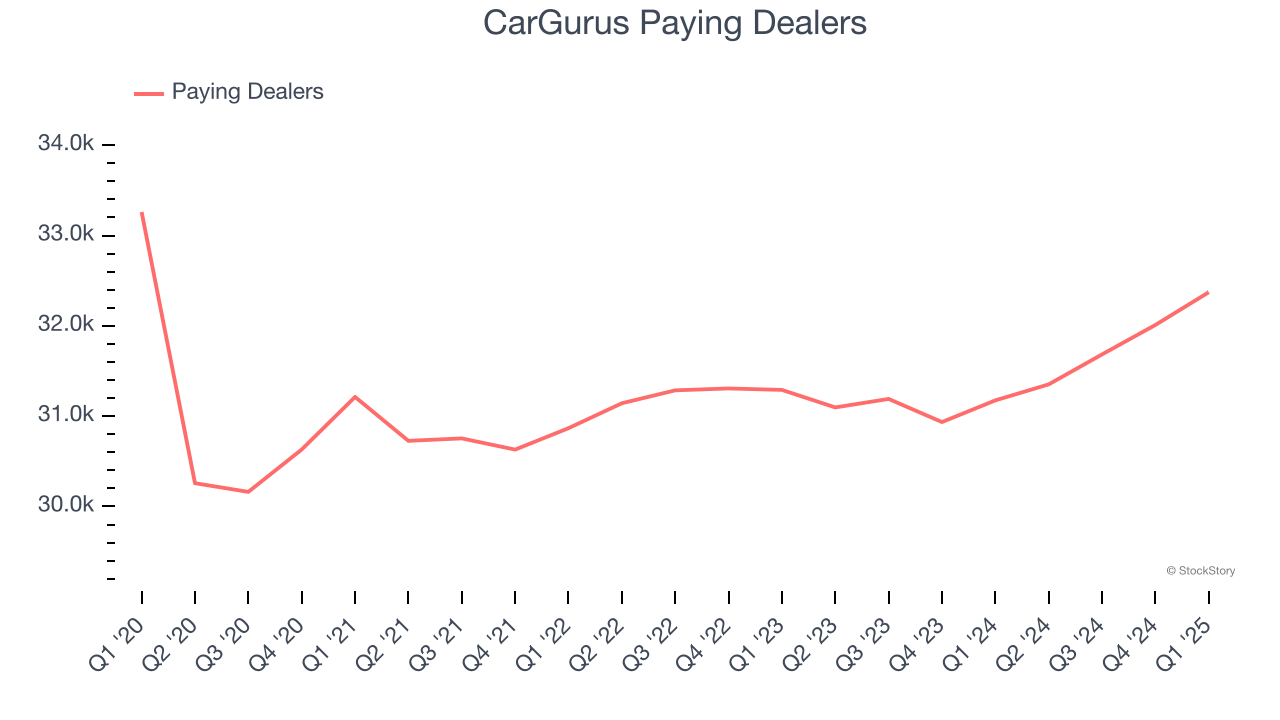
Luckily, CarGurus added 1,197 paying dealers in Q1, leading to 3.8% year-on-year growth. The quarterly print was higher than its two-year result, suggesting its new initiatives are accelerating user growth.
Revenue Per User
Average revenue per user (ARPU) is a critical metric to track because it measures how much the company earns in transaction fees from each user. ARPU also gives us unique insights into a user’s average order size and CarGurus’s take rate, or "cut", on each order.
CarGurus’s ARPU growth has been exceptional over the last two years, averaging 11%. Although its paying dealers were flat during this time, the company’s ability to successfully increase monetization demonstrates its platform’s value for existing users. 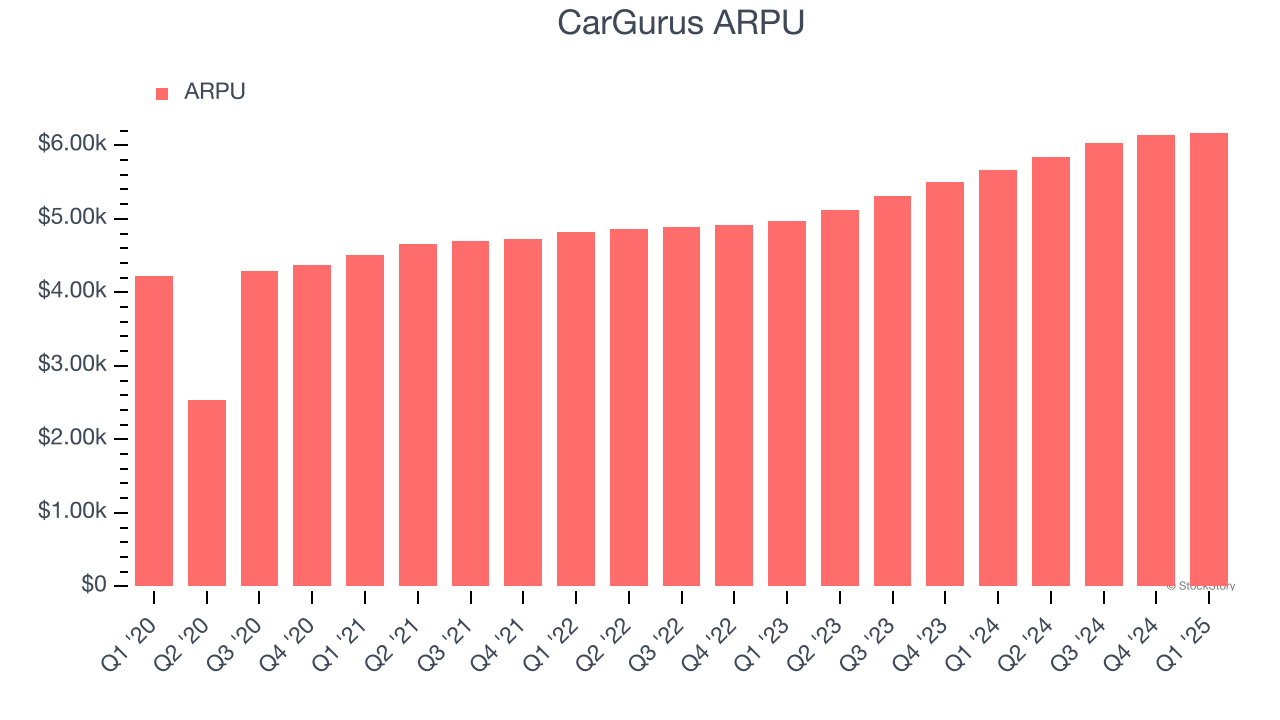
This quarter, CarGurus’s ARPU clocked in at $6,173. It grew by 9% year on year, faster than its paying dealers.
Key Takeaways from CarGurus’s Q1 Results
We were impressed by CarGurus’s optimistic EPS and EBITDA guidance for next quarter, which blew past analysts’ expectations. We were also glad this quarter's EPS and EBITDA outperformed Wall Street’s estimates. Overall, this print was solid. The stock traded up 5% to $29.35 immediately after reporting.
Is CarGurus an attractive investment opportunity right now? When making that decision, it’s important to consider its valuation, business qualities, as well as what has happened in the latest quarter. We cover that in our actionable full research report which you can read here, it’s free.