
Fantasy sports and betting company DraftKings (NASDAQ: DKNG) missed Wall Street’s revenue expectations in Q1 CY2025, but sales rose 19.9% year on year to $1.41 billion. The company’s full-year revenue guidance of $6.3 billion at the midpoint came in 1.1% below analysts’ estimates. Its non-GAAP profit of $0.12 per share was in line with analysts’ consensus estimates.
Is now the time to buy DraftKings? Find out by accessing our full research report, it’s free.
DraftKings (DKNG) Q1 CY2025 Highlights:
- Revenue: $1.41 billion vs analyst estimates of $1.45 billion (19.9% year-on-year growth, 3.1% miss)
- Adjusted EPS: $0.12 vs analyst estimates of $0.12 (in line)
- Adjusted EBITDA: $102.6 million vs analyst estimates of $98.92 million (7.3% margin, 3.8% beat)
- The company dropped its revenue guidance for the full year to $6.3 billion at the midpoint from $6.45 billion, a 2.3% decrease
- EBITDA guidance for the full year is $850 million at the midpoint, below analyst estimates of $910.4 million
- Operating Margin: -3.3%, up from -11.8% in the same quarter last year
- Free Cash Flow was -$152.9 million compared to -$73.42 million in the same quarter last year
- Monthly Unique Payers: 4.3 million, up 900,000 year on year
- Market Capitalization: $17.33 billion
“Recent product enhancements are driving outperformance in our core value drivers, and our customer metrics continue to be strong through an evolving macroeconomic environment,” said Jason Robins, DraftKings’ Chief Executive Officer and Co-founder.
Company Overview
Getting its start in daily fantasy sports, DraftKings (NASDAQ: DKNG) is a digital sports entertainment and gaming company.
Sales Growth
A company’s long-term performance is an indicator of its overall quality. Any business can have short-term success, but a top-tier one grows for years. Thankfully, DraftKings’s 61.7% annualized revenue growth over the last five years was incredible. Its growth beat the average consumer discretionary company and shows its offerings resonate with customers, a helpful starting point for our analysis.
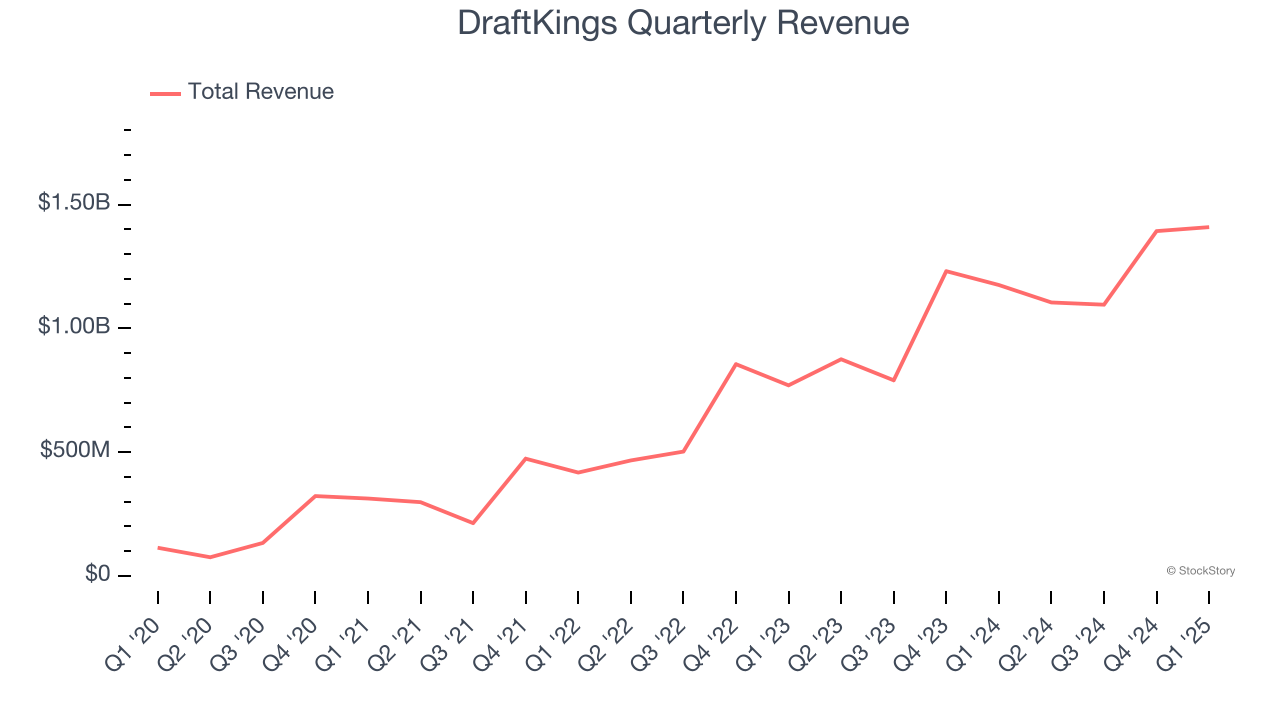
Long-term growth is the most important, but within consumer discretionary, product cycles are short and revenue can be hit-driven due to rapidly changing trends and consumer preferences. DraftKings’s annualized revenue growth of 38.9% over the last two years is below its five-year trend, but we still think the results suggest healthy demand. 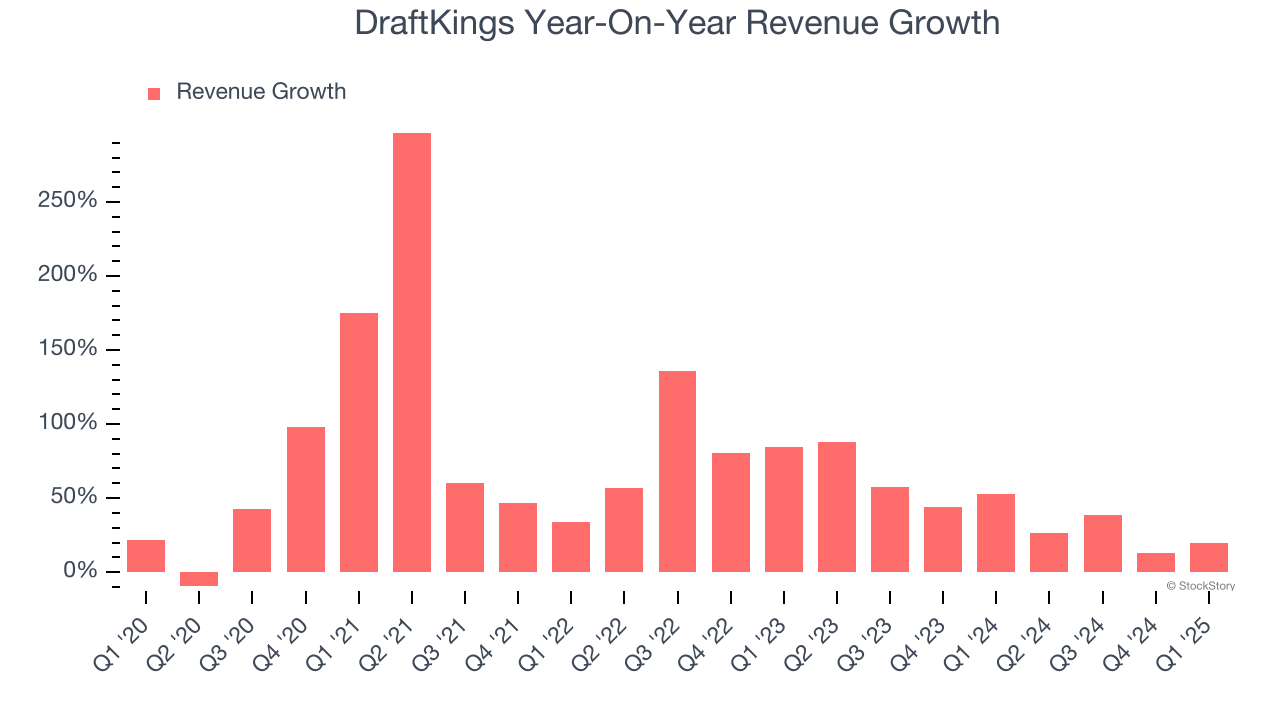
This quarter, DraftKings’s revenue grew by 19.9% year on year to $1.41 billion but fell short of Wall Street’s estimates.
Looking ahead, sell-side analysts expect revenue to grow 34.1% over the next 12 months, a deceleration versus the last two years. Despite the slowdown, this projection is healthy and suggests the market sees success for its products and services.
Here at StockStory, we certainly understand the potential of thematic investing. Diverse winners from Microsoft (MSFT) to Alphabet (GOOG), Coca-Cola (KO) to Monster Beverage (MNST) could all have been identified as promising growth stories with a megatrend driving the growth. So, in that spirit, we’ve identified a relatively under-the-radar profitable growth stock benefiting from the rise of AI, available to you FREE via this link.
Operating Margin
DraftKings’s operating margin has risen over the last 12 months, but it still averaged negative 11.6% over the last two years. This is due to its large expense base and inefficient cost structure. It might have a shot at long-term profitability if it can scale quickly and gain operating leverage.
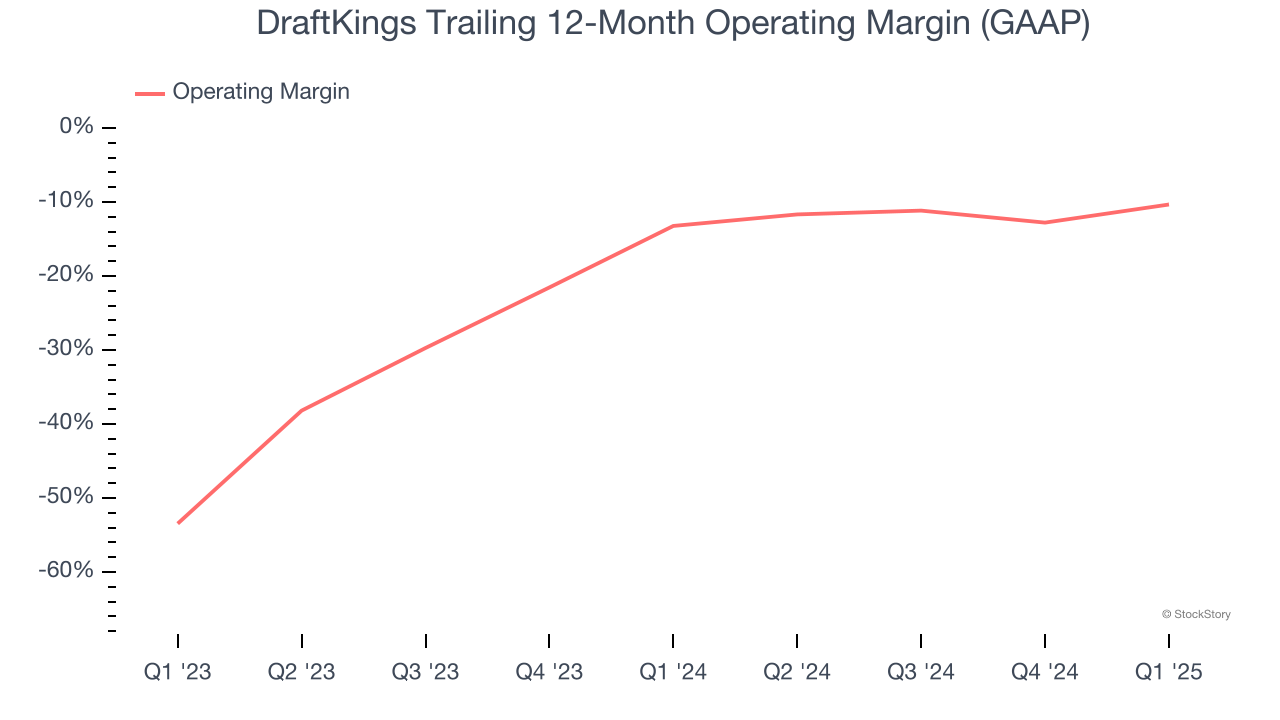
In Q1, DraftKings generated a negative 3.3% operating margin.
Earnings Per Share
We track the long-term change in earnings per share (EPS) for the same reason as long-term revenue growth. Compared to revenue, however, EPS highlights whether a company’s growth is profitable.
DraftKings’s full-year EPS flipped from negative to positive over the last five years. This is a good sign and shows it’s at an inflection point.
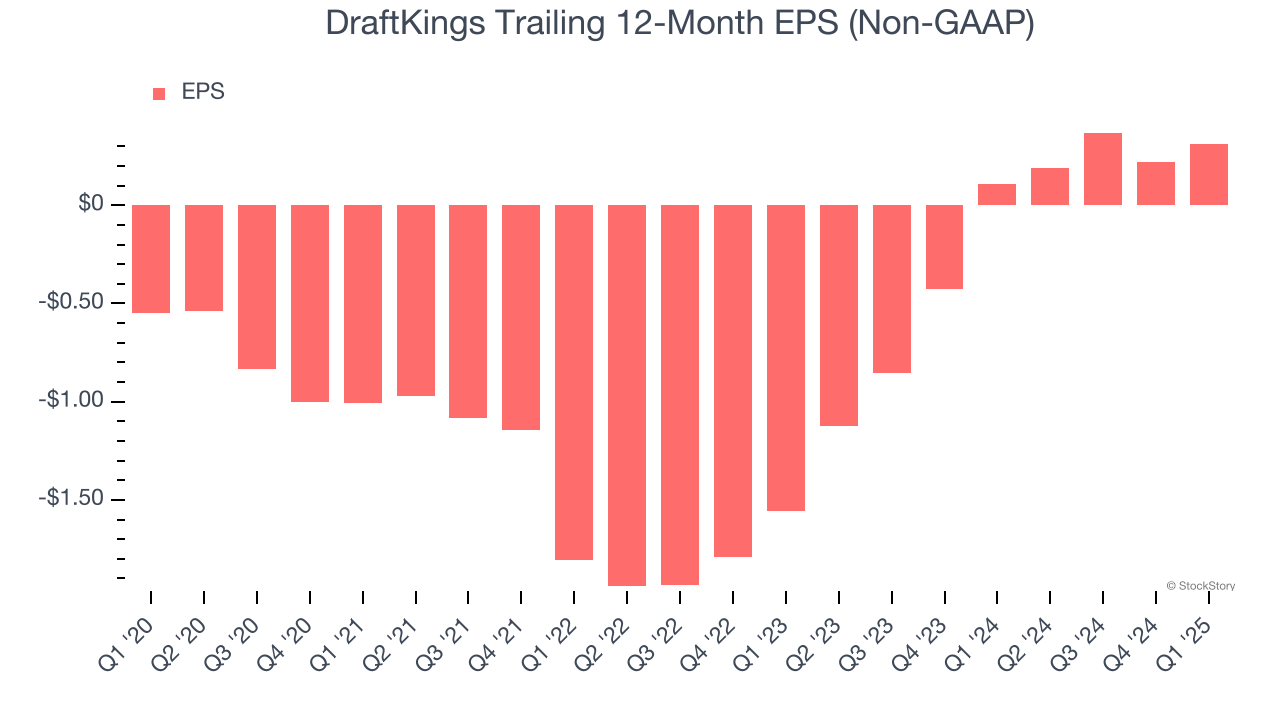
In Q1, DraftKings reported EPS at $0.12, up from $0.03 in the same quarter last year. Despite growing year on year, this print missed analysts’ estimates, but we care more about long-term EPS growth than short-term movements. Over the next 12 months, Wall Street expects DraftKings’s full-year EPS of $0.31 to grow 436%.
Key Takeaways from DraftKings’s Q1 Results
It was encouraging to see DraftKings beat analysts’ EBITDA expectations this quarter. On the other hand, its revenue missed and it lowered its full-year revenue and EBITDA guidance. Overall, this was a softer quarter, but the stock traded up 2.3% to $36.23 immediately after reporting.
So should you invest in DraftKings right now? When making that decision, it’s important to consider its valuation, business qualities, as well as what has happened in the latest quarter. We cover that in our actionable full research report which you can read here, it’s free.


