Media, broadcasting, and digital services company E.W. Scripps (NASDAQ: SSP) reported Q1 CY2025 results beating Wall Street’s revenue expectations, but sales fell by 6.6% year on year to $524.4 million. Its GAAP loss of $0.22 per share was 26.7% above analysts’ consensus estimates.
Is now the time to buy E.W. Scripps? Find out by accessing our full research report, it’s free.
E.W. Scripps (SSP) Q1 CY2025 Highlights:
- Revenue: $524.4 million vs analyst estimates of $520.8 million (6.6% year-on-year decline, 0.7% beat)
- EPS (GAAP): -$0.22 vs analyst estimates of -$0.30 (26.7% beat)
- Adjusted EBITDA: $75.61 million vs analyst estimates of $63.28 million (14.4% margin, 19.5% beat)
- Operating Margin: 5.2%, down from 7.7% in the same quarter last year
- Market Capitalization: $207.2 million
Company Overview
Founded as a chain of daily newspapers, E.W. Scripps (NASDAQ: SSP) is a diversified media enterprise operating a range of local television stations, national networks, and digital media platforms.
Sales Growth
A company’s long-term sales performance is one signal of its overall quality. Even a bad business can shine for one or two quarters, but a top-tier one grows for years. Over the last five years, E.W. Scripps grew its sales at a 10.7% annual rate. Although this growth is acceptable on an absolute basis, it fell short of our standards for the consumer discretionary sector, which enjoys a number of secular tailwinds.
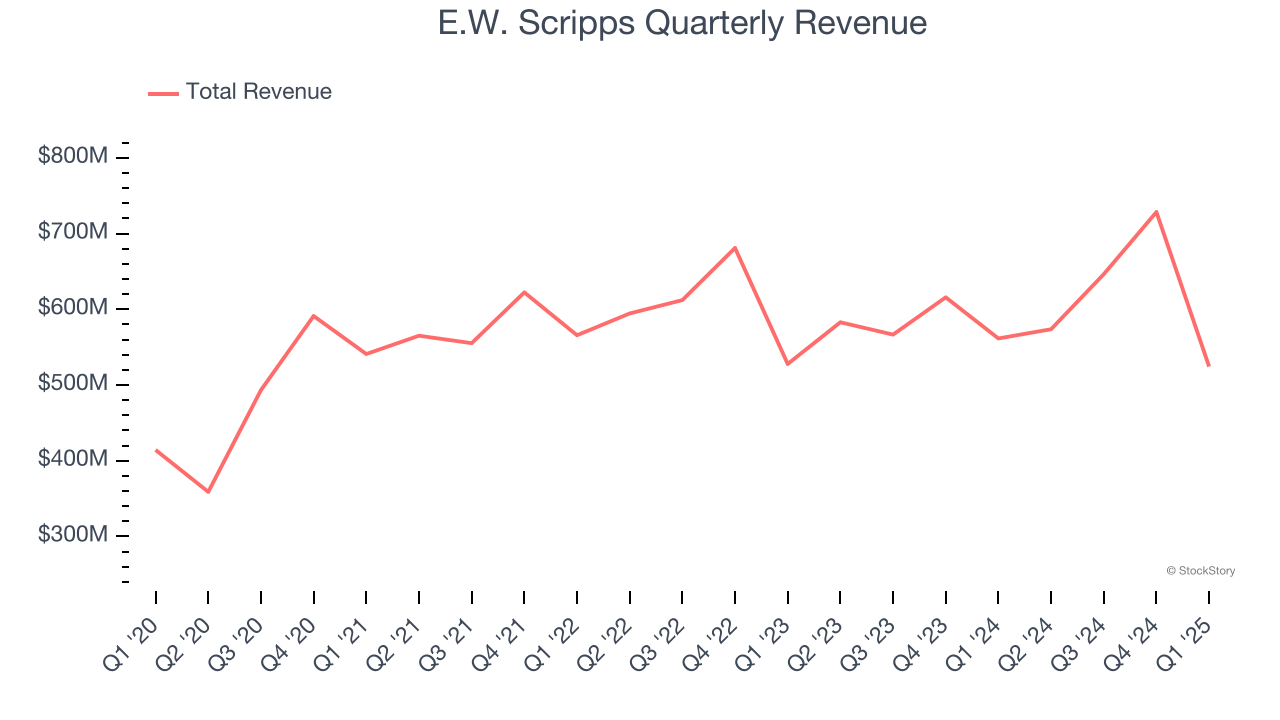
Long-term growth is the most important, but within consumer discretionary, product cycles are short and revenue can be hit-driven due to rapidly changing trends and consumer preferences. E.W. Scripps’s recent performance shows its demand has slowed as its annualized revenue growth of 1.2% over the last two years was below its five-year trend. 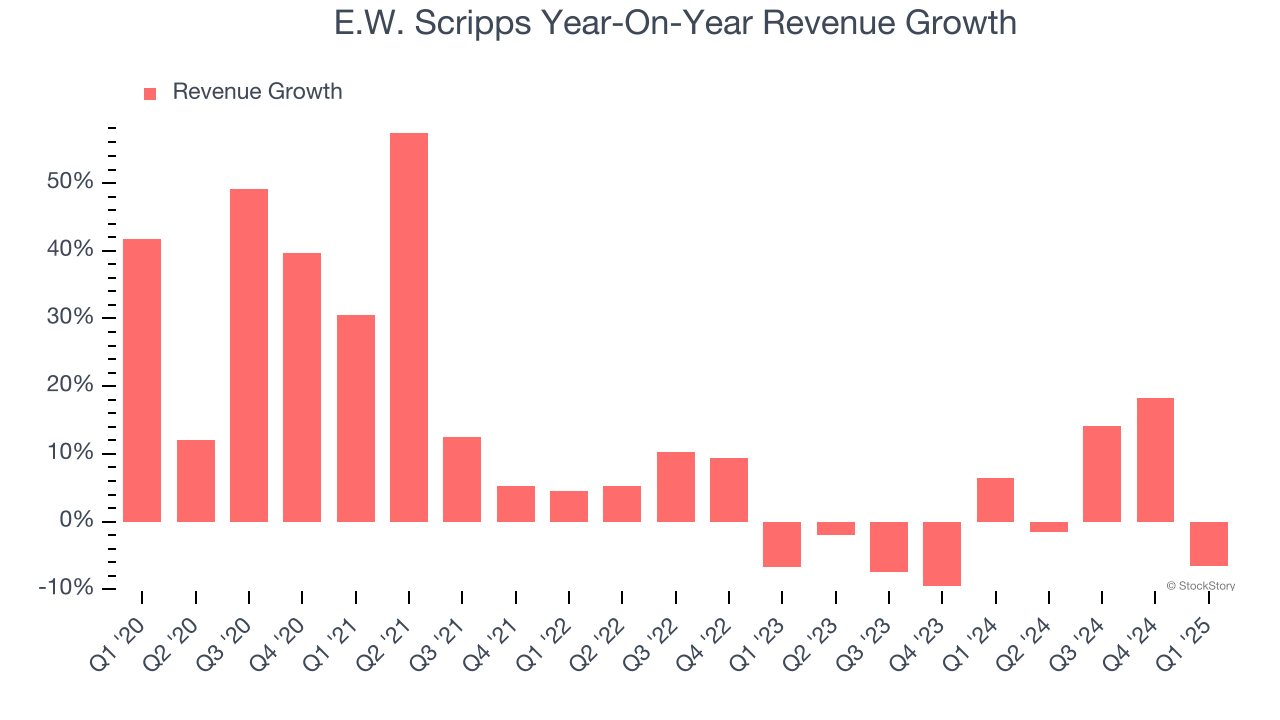
This quarter, E.W. Scripps’s revenue fell by 6.6% year on year to $524.4 million but beat Wall Street’s estimates by 0.7%.
Looking ahead, sell-side analysts expect revenue to decline by 13% over the next 12 months, a deceleration versus the last two years. This projection doesn't excite us and suggests its products and services will face some demand challenges.
Software is eating the world and there is virtually no industry left that has been untouched by it. That drives increasing demand for tools helping software developers do their jobs, whether it be monitoring critical cloud infrastructure, integrating audio and video functionality, or ensuring smooth content streaming. Click here to access a free report on our 3 favorite stocks to play this generational megatrend.
Operating Margin
E.W. Scripps’s operating margin has been trending up over the last 12 months, but it still averaged negative 6.9% over the last two years. This is due to its large expense base and inefficient cost structure.
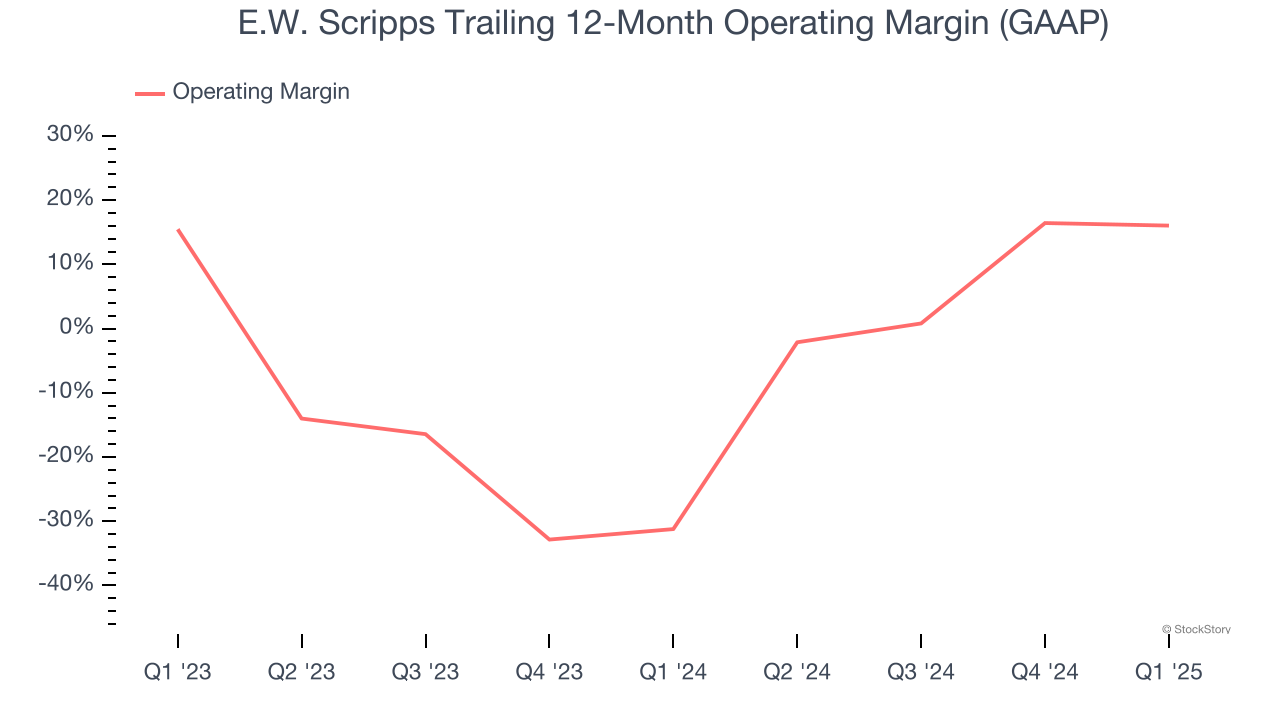
This quarter, E.W. Scripps generated an operating profit margin of 5.2%, down 2.5 percentage points year on year. This contraction shows it was less efficient because its expenses increased relative to its revenue.
Earnings Per Share
Revenue trends explain a company’s historical growth, but the long-term change in earnings per share (EPS) points to the profitability of that growth – for example, a company could inflate its sales through excessive spending on advertising and promotions.
E.W. Scripps’s full-year EPS flipped from negative to positive over the last five years. This is encouraging and shows it’s at a critical moment in its life.
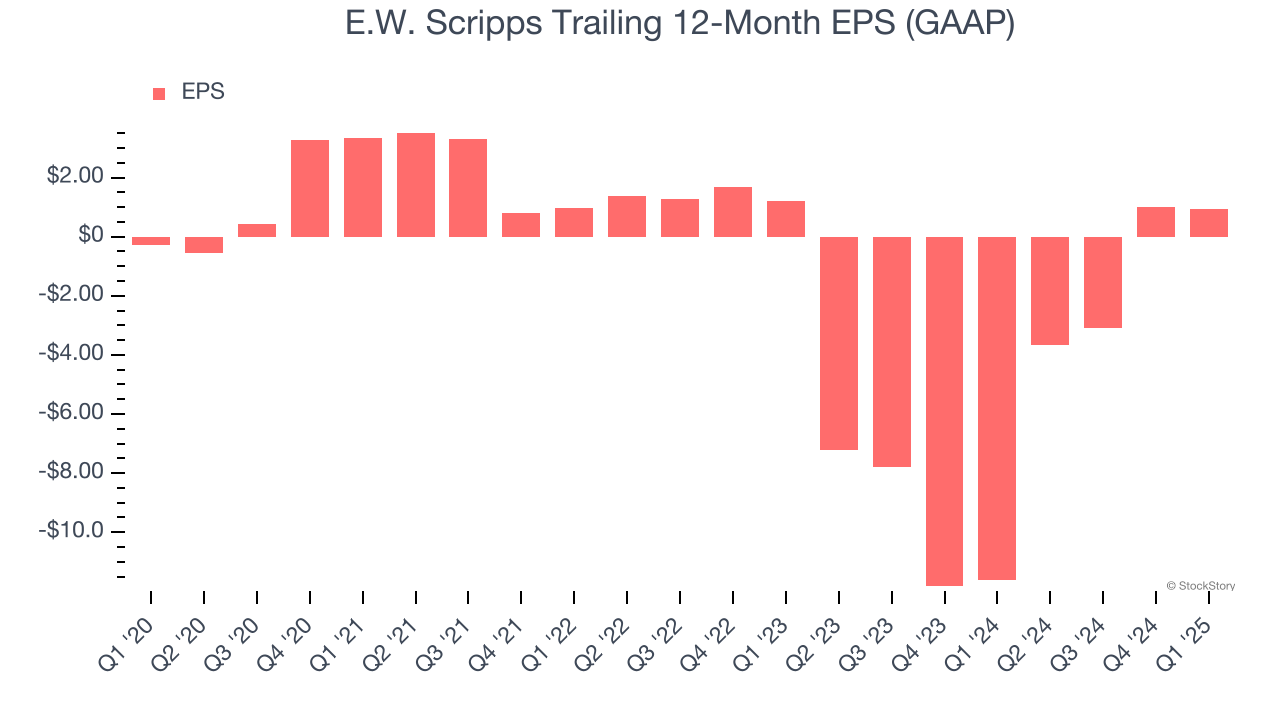
In Q1, E.W. Scripps reported EPS at negative $0.22, down from negative $0.15 in the same quarter last year. Despite falling year on year, this print easily cleared analysts’ estimates. We also like to analyze expected EPS growth based on Wall Street analysts’ consensus projections, but there is insufficient data.
Key Takeaways from E.W. Scripps’s Q1 Results
We enjoyed seeing E.W. Scripps beat analysts’ revenue, EPS, and EBITDA expectations this quarter. Zooming out, we think this quarter featured some important positives. The stock remained flat at $2.60 immediately after reporting.
E.W. Scripps had an encouraging quarter, but one earnings result doesn’t necessarily make the stock a buy. Let’s see if this is a good investment. The latest quarter does matter, but not nearly as much as longer-term fundamentals and valuation, when deciding if the stock is a buy. We cover that in our actionable full research report which you can read here, it’s free.