
Energy drink company Monster Beverage (NASDAQ: MNST) missed Wall Street’s revenue expectations in Q1 CY2025, with sales falling 2.3% year on year to $1.85 billion. Its non-GAAP profit of $0.47 per share was 2.2% above analysts’ consensus estimates.
Is now the time to buy Monster? Find out by accessing our full research report, it’s free.
Monster (MNST) Q1 CY2025 Highlights:
- Revenue: $1.85 billion vs analyst estimates of $1.98 billion (2.3% year-on-year decline, 6.3% miss)
- Adjusted EPS: $0.47 vs analyst estimates of $0.46 (2.2% beat)
- Operating Margin: 30.7%, up from 28.5% in the same quarter last year
- Market Capitalization: $59.06 billion
Hilton H. Schlosberg, Vice Chairman and Co-Chief Executive Officer, said, “Our first quarter revenues were impacted by a number of headwinds including bottler/distributor ordering patterns, unfavorable foreign currency exchange rates in certain markets, adverse weather in certain geographies as well as overall global economic uncertainties. Despite these headwinds, net sales excluding the Alcohol Brands segment, on a foreign currency adjusted basis, increased 1.9 percent in the quarter.
Company Overview
Founded in 2002 as a natural soda and juice company, Monster Beverage (NASDAQ: MNST) is a pioneer of the energy drink category, and its Monster Energy brand targets a young, active demographic.
Sales Growth
A company’s long-term performance is an indicator of its overall quality. Any business can put up a good quarter or two, but many enduring ones grow for years.
With $7.45 billion in revenue over the past 12 months, Monster is one of the larger consumer staples companies and benefits from a well-known brand that influences purchasing decisions.
As you can see below, Monster’s sales grew at a decent 8.6% compounded annual growth rate over the last three years. This shows its offerings generated slightly more demand than the average consumer staples company, a helpful starting point for our analysis.
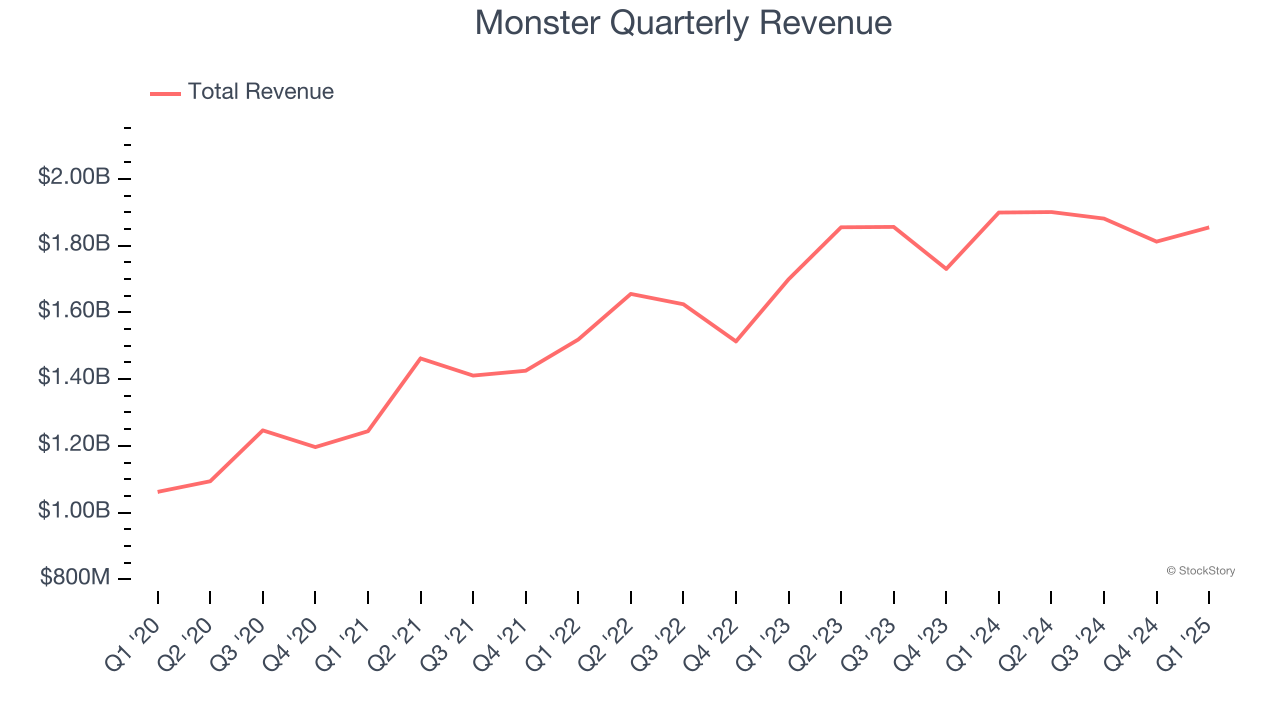
This quarter, Monster missed Wall Street’s estimates and reported a rather uninspiring 2.3% year-on-year revenue decline, generating $1.85 billion of revenue.
Looking ahead, sell-side analysts expect revenue to grow 9.6% over the next 12 months, similar to its three-year rate. This projection is healthy and suggests the market sees success for its products.
Unless you’ve been living under a rock, it should be obvious by now that generative AI is going to have a huge impact on how large corporations do business. While Nvidia and AMD are trading close to all-time highs, we prefer a lesser-known (but still profitable) stock benefiting from the rise of AI. Click here to access our free report one of our favorites growth stories.
Cash Is King
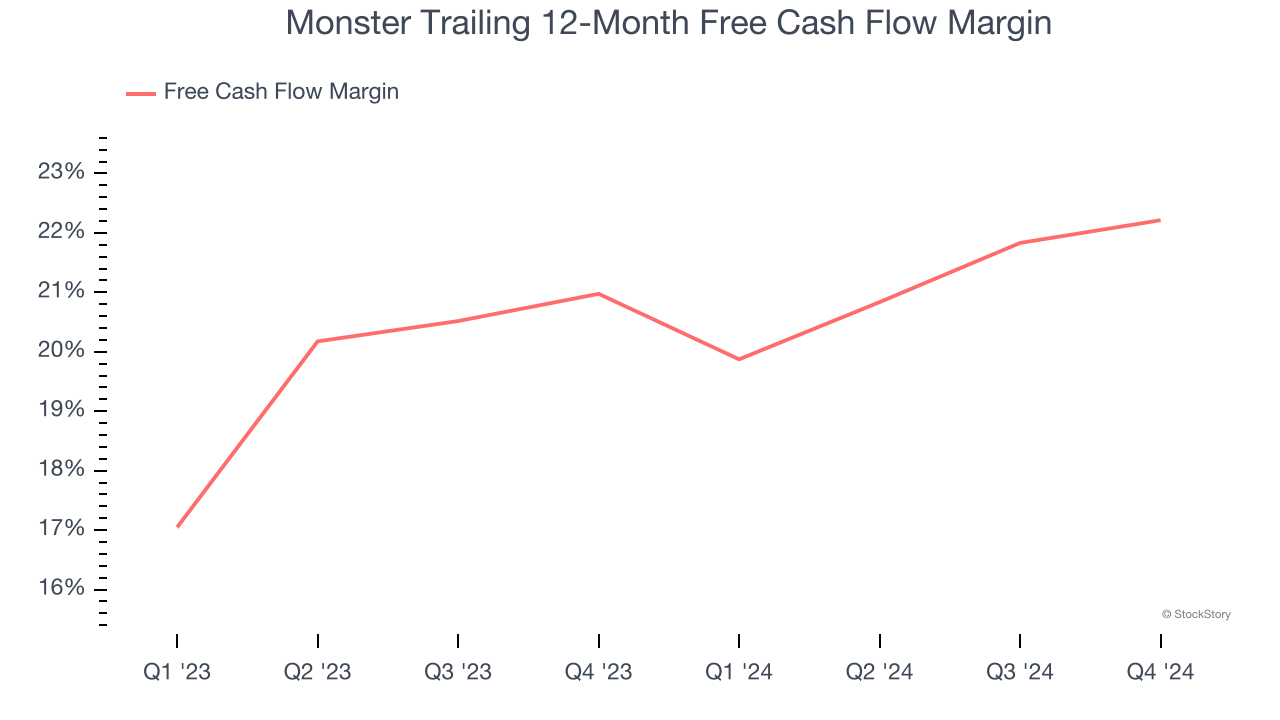
Although earnings are undoubtedly valuable for assessing company performance, we believe cash is king because you can’t use accounting profits to pay the bills.
Monster has shown terrific cash profitability, driven by its lucrative business model that enables it to reinvest, return capital to investors, and stay ahead of the competition. The company’s free cash flow margin was among the best in the consumer staples sector, averaging 21.5% over the last two years.
Key Takeaways from Monster’s Q1 Results
It was encouraging to see Monster beat analysts’ gross margin expectations this quarter. On the other hand, its revenue missed significantly. Overall, this quarter could have been better. The stock traded down 2.4% to $58.66 immediately after reporting.
Monster’s latest earnings report disappointed. One quarter doesn’t define a company’s quality, so let’s explore whether the stock is a buy at the current price. When making that decision, it’s important to consider its valuation, business qualities, as well as what has happened in the latest quarter. We cover that in our actionable full research report which you can read here, it’s free.