Global media and publishing company News Corp (NASDAQ: NWSA) reported Q1 CY2025 results topping the market’s revenue expectations, but sales fell by 17.1% year on year to $2.01 billion. Its non-GAAP profit of $0.17 per share was 27.5% above analysts’ consensus estimates.
Is now the time to buy News Corp? Find out by accessing our full research report, it’s free.
News Corp (NWSA) Q1 CY2025 Highlights:
- Revenue: $2.01 billion vs analyst estimates of $1.99 billion (17.1% year-on-year decline, 0.8% beat)
- Adjusted EPS: $0.17 vs analyst estimates of $0.13 (27.5% beat)
- Adjusted EBITDA: $301 million vs analyst estimates of $267 million (15% margin, 12.7% beat)
- Operating Margin: 7.5%, up from 5.4% in the same quarter last year
- Free Cash Flow Margin: 26.8%, up from 17.4% in the same quarter last year
- Market Capitalization: $16.8 billion
Company Overview
Established in 2013 after a restructuring, News Corp (NASDAQ: NWSA) is a multinational conglomerate known for its news publishing, broadcasting, digital media, and book publishing.
Sales Growth
A company’s long-term sales performance can indicate its overall quality. Even a bad business can shine for one or two quarters, but a top-tier one grows for years. News Corp struggled to consistently generate demand over the last five years as its sales dropped at a 1.4% annual rate. This wasn’t a great result and is a sign of poor business quality.
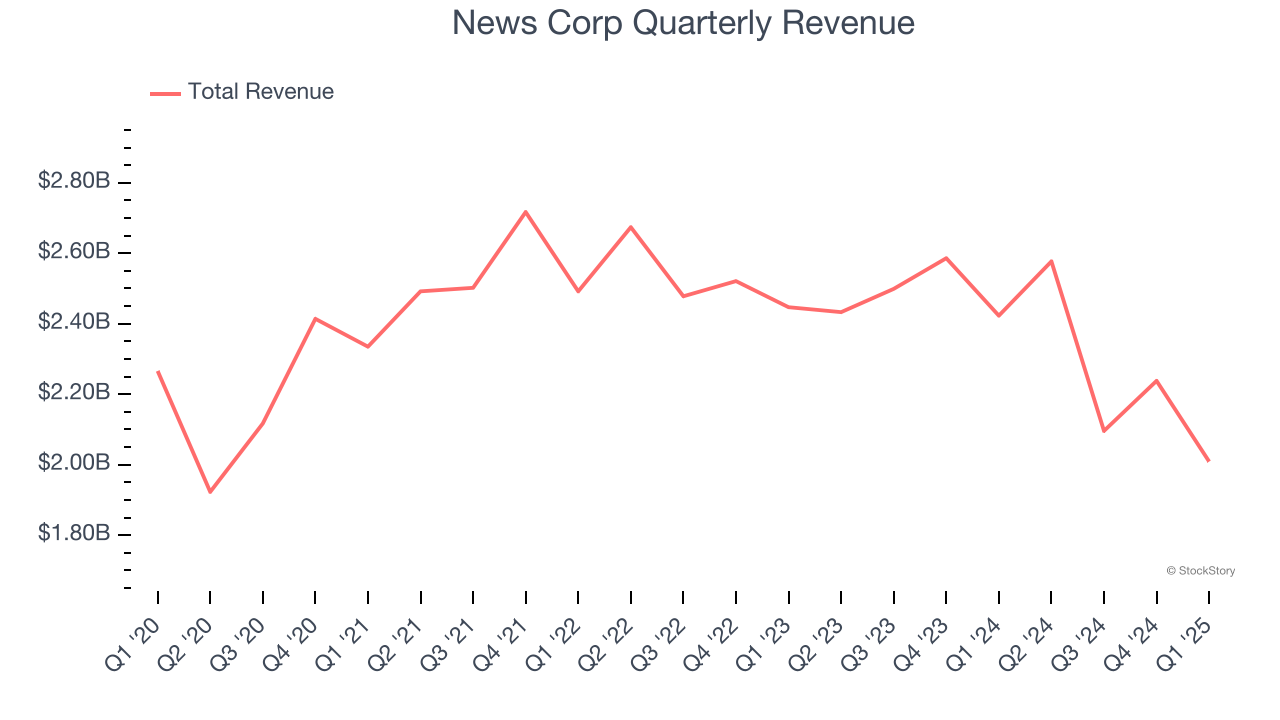
We at StockStory place the most emphasis on long-term growth, but within consumer discretionary, a stretched historical view may miss a company riding a successful new product or trend. News Corp’s recent performance shows its demand remained suppressed as its revenue has declined by 6.1% annually over the last two years. 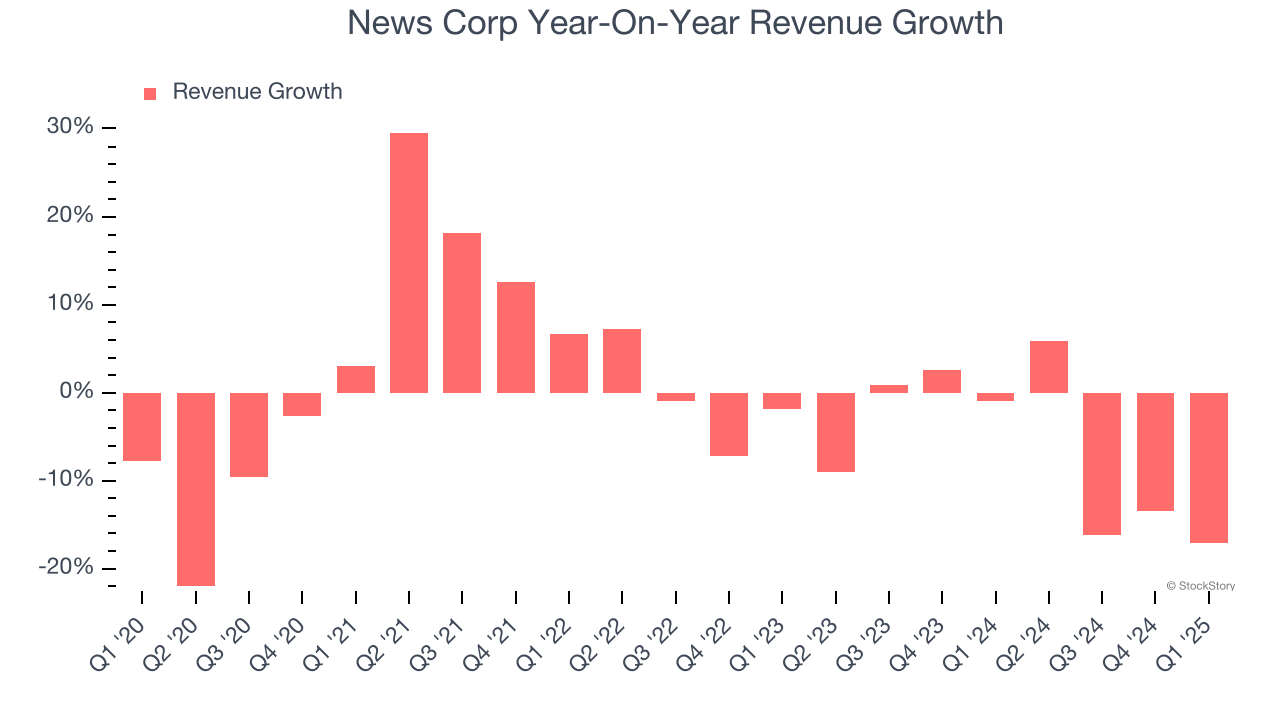
We can better understand the company’s revenue dynamics by analyzing its three most important segments: Dow Jones, News Media, and Book Publishing, which are 28.6%, 25.6%, and 25.6% of revenue. Over the last two years, News Corp’s Dow Jones (media subsidiary) and Book Publishing (general publishing) revenues averaged year-on-year growth of 2.8% and 3.1%. On the other hand, its News Media revenue (general media) averaged 3.3% declines.
This quarter, News Corp’s revenue fell by 17.1% year on year to $2.01 billion but beat Wall Street’s estimates by 0.8%.
Looking ahead, sell-side analysts expect revenue to decline by 3.4% over the next 12 months. Although this projection is better than its two-year trend, it's tough to feel optimistic about a company facing demand difficulties.
Software is eating the world and there is virtually no industry left that has been untouched by it. That drives increasing demand for tools helping software developers do their jobs, whether it be monitoring critical cloud infrastructure, integrating audio and video functionality, or ensuring smooth content streaming. Click here to access a free report on our 3 favorite stocks to play this generational megatrend.
Operating Margin
Operating margin is a key measure of profitability. Think of it as net income - the bottom line - excluding the impact of taxes and interest on debt, which are less connected to business fundamentals.
News Corp’s operating margin has been trending up over the last 12 months and averaged 9% over the last two years. The company’s higher efficiency is a breath of fresh air, but its suboptimal cost structure means it still sports mediocre profitability for a consumer discretionary business.
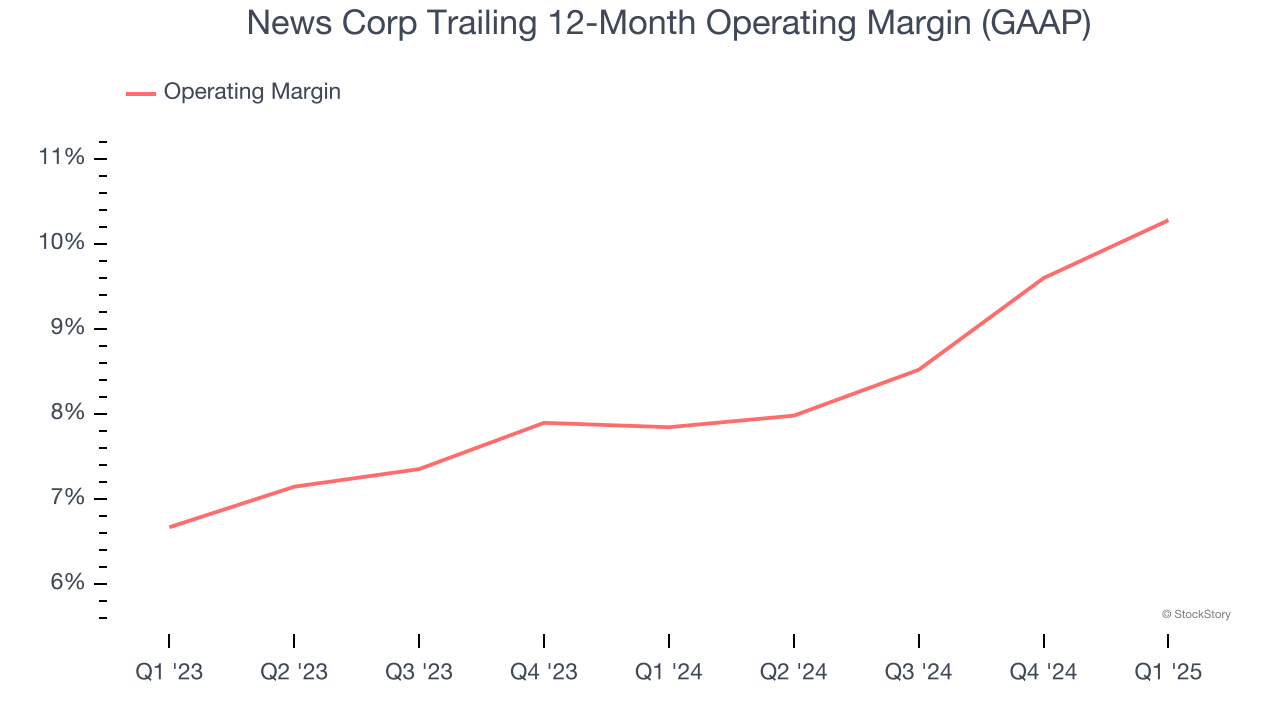
This quarter, News Corp generated an operating profit margin of 7.5%, up 2.2 percentage points year on year. This increase was a welcome development, especially since its revenue fell, showing it was more efficient because it scaled down its expenses.
Earnings Per Share
We track the long-term change in earnings per share (EPS) for the same reason as long-term revenue growth. Compared to revenue, however, EPS highlights whether a company’s growth is profitable.
News Corp’s EPS grew at a spectacular 21.8% compounded annual growth rate over the last five years, higher than its 1.4% annualized revenue declines. This tells us management adapted its cost structure in response to a challenging demand environment.
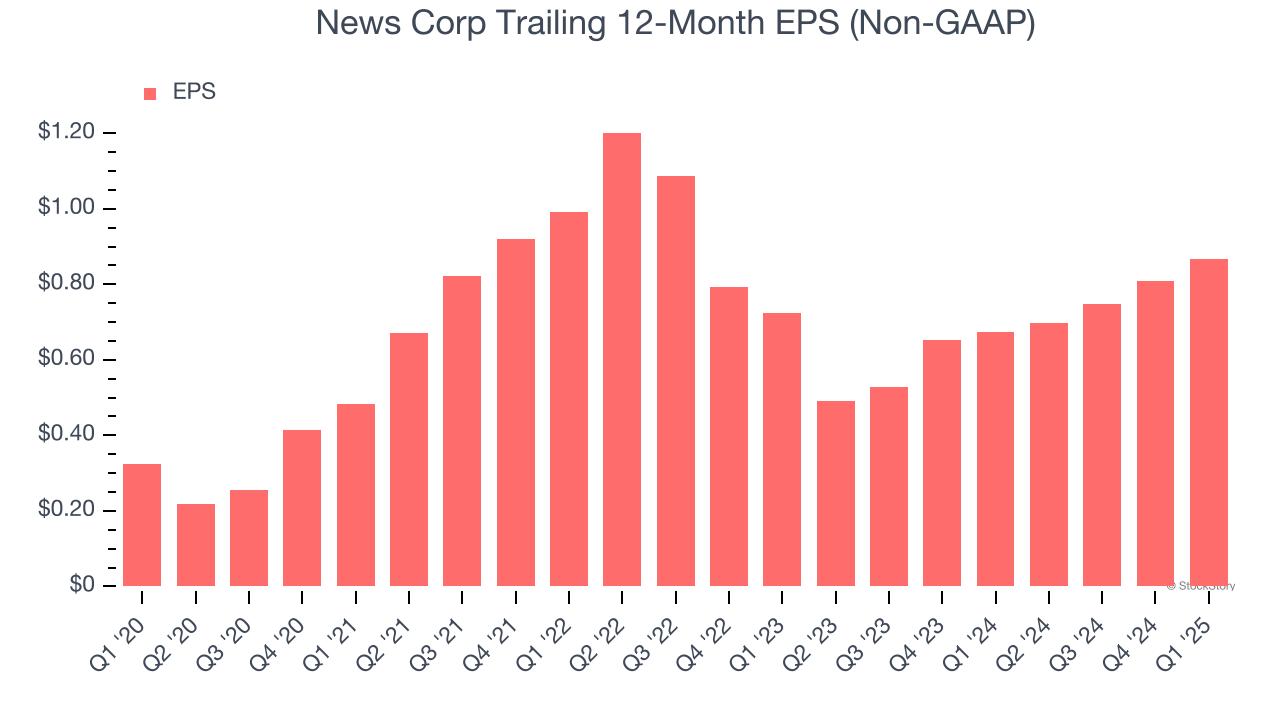
In Q1, News Corp reported EPS at $0.17, up from $0.11 in the same quarter last year. This print easily cleared analysts’ estimates, and shareholders should be content with the results. Over the next 12 months, Wall Street expects News Corp’s full-year EPS of $0.87 to grow 3.1%.
Key Takeaways from News Corp’s Q1 Results
We enjoyed seeing News Corp beat analysts’ revenue, EPS, and EBITDA expectations this quarter. Zooming out, we think this was a good print with some key areas of upside. The stock traded up 2.8% to $29.29 immediately following the results.
Indeed, News Corp had a rock-solid quarterly earnings result, but is this stock a good investment here? We think that the latest quarter is only one piece of the longer-term business quality puzzle. Quality, when combined with valuation, can help determine if the stock is a buy. We cover that in our actionable full research report which you can read here, it’s free.