Local broadcasting and digital media company Nexstar (NASDAQ: NXST) announced better-than-expected revenue in Q1 CY2025, but sales fell by 3.9% year on year to $1.23 billion. Its GAAP profit of $3.37 per share was 8.4% above analysts’ consensus estimates.
Is now the time to buy Nexstar Media? Find out by accessing our full research report, it’s free.
Nexstar Media (NXST) Q1 CY2025 Highlights:
- Revenue: $1.23 billion vs analyst estimates of $1.23 billion (3.9% year-on-year decline, 0.6% beat)
- EPS (GAAP): $3.37 vs analyst estimates of $3.11 (8.4% beat)
- Adjusted EBITDA: $381 million vs analyst estimates of $359.7 million (30.9% margin, 5.9% beat)
- Operating Margin: 17.8%, down from 21.4% in the same quarter last year
- Free Cash Flow Margin: 24.5%, down from 28.7% in the same quarter last year
- Market Capitalization: $4.71 billion
Company Overview
Founded in 1996, Nexstar (NASDAQ: NXST) is an American media company operating numerous local television stations and digital media outlets across the country.
Sales Growth
Reviewing a company’s long-term sales performance reveals insights into its quality. Even a bad business can shine for one or two quarters, but a top-tier one grows for years. Regrettably, Nexstar Media’s sales grew at a sluggish 8.9% compounded annual growth rate over the last five years. This was below our standard for the consumer discretionary sector and is a tough starting point for our analysis.
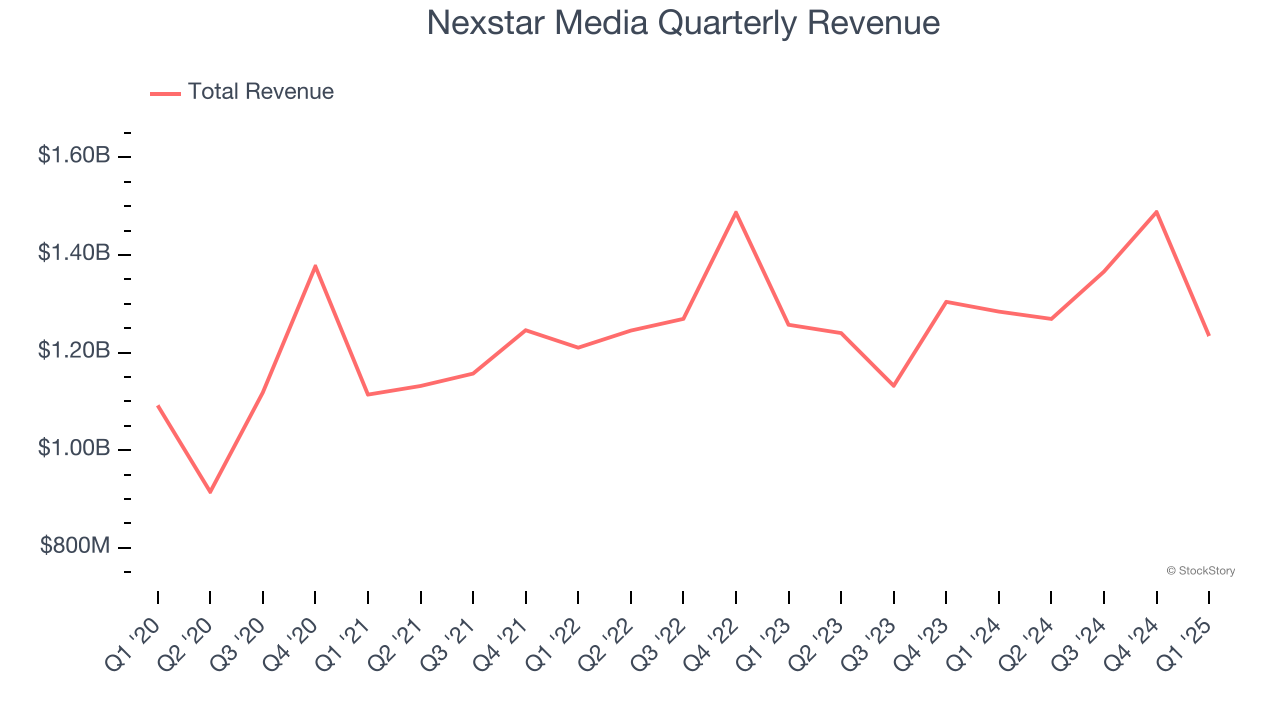
We at StockStory place the most emphasis on long-term growth, but within consumer discretionary, a stretched historical view may miss a company riding a successful new product or trend. Nexstar Media’s recent performance shows its demand has slowed as its revenue was flat over the last two years. 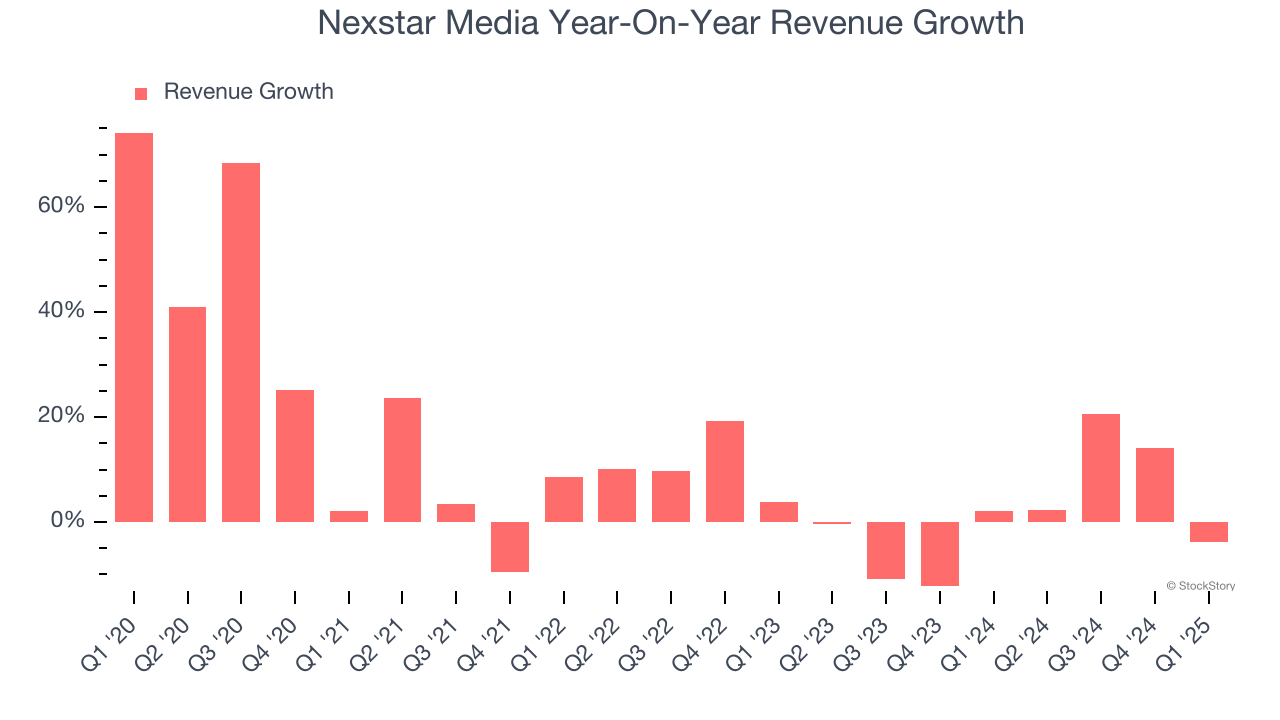
Nexstar Media also breaks out the revenue for its most important segments, Distribution and Core Advertising, which are 61.8% and 37.3% of revenue. Over the last two years, Nexstar Media’s Distribution revenue (licensing and affiliate fees) averaged 5.9% year-on-year growth. On the other hand, its Core Advertising revenue (TV and radio ads) averaged 4.2% declines.
This quarter, Nexstar Media’s revenue fell by 3.9% year on year to $1.23 billion but beat Wall Street’s estimates by 0.6%.
Looking ahead, sell-side analysts expect revenue to decline by 6.8% over the next 12 months, a deceleration versus the last two years. This projection is underwhelming and implies its products and services will face some demand challenges.
Software is eating the world and there is virtually no industry left that has been untouched by it. That drives increasing demand for tools helping software developers do their jobs, whether it be monitoring critical cloud infrastructure, integrating audio and video functionality, or ensuring smooth content streaming. Click here to access a free report on our 3 favorite stocks to play this generational megatrend.
Operating Margin
Nexstar Media’s operating margin has been trending up over the last 12 months and averaged 19.3% over the last two years. On top of that, its profitability was top-notch for a consumer discretionary business, showing it’s an well-run company with an efficient cost structure.
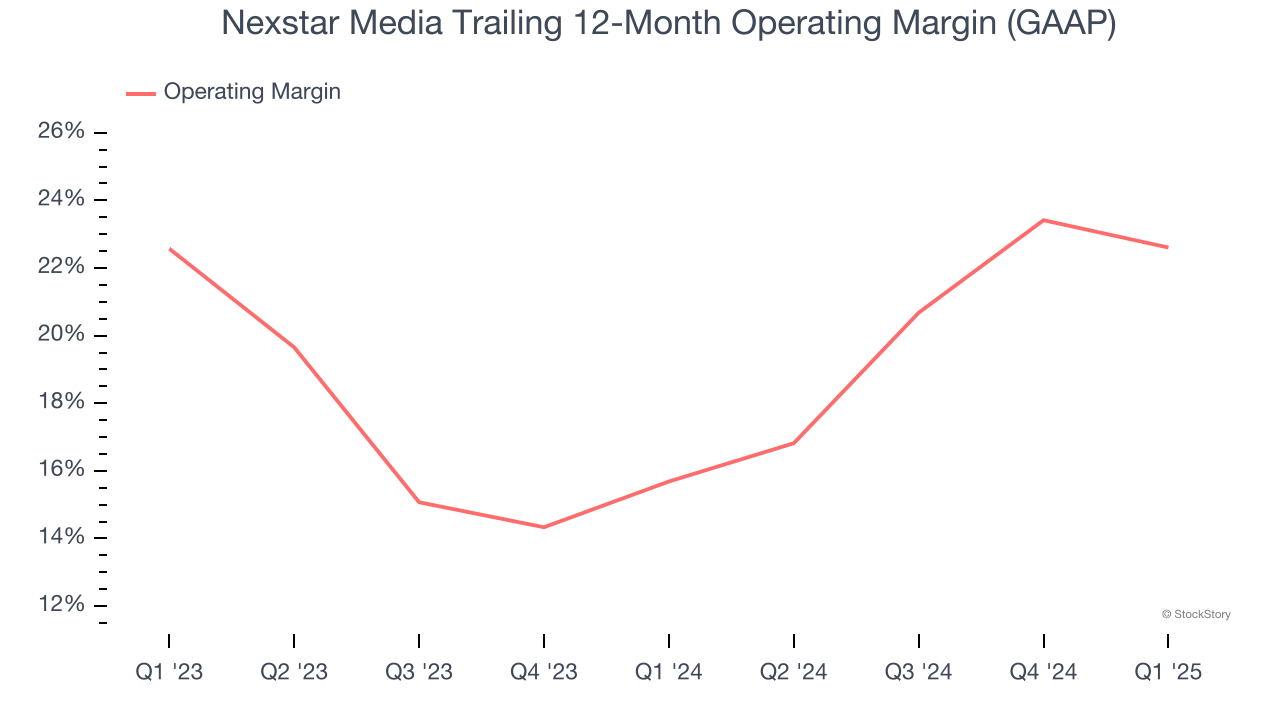
This quarter, Nexstar Media generated an operating profit margin of 17.8%, down 3.6 percentage points year on year. This contraction shows it was less efficient because its expenses increased relative to its revenue.
Earnings Per Share
We track the long-term change in earnings per share (EPS) for the same reason as long-term revenue growth. Compared to revenue, however, EPS highlights whether a company’s growth is profitable.
Nexstar Media’s EPS grew at a spectacular 24% compounded annual growth rate over the last five years, higher than its 8.9% annualized revenue growth. However, this alone doesn’t tell us much about its business quality because its operating margin didn’t expand.
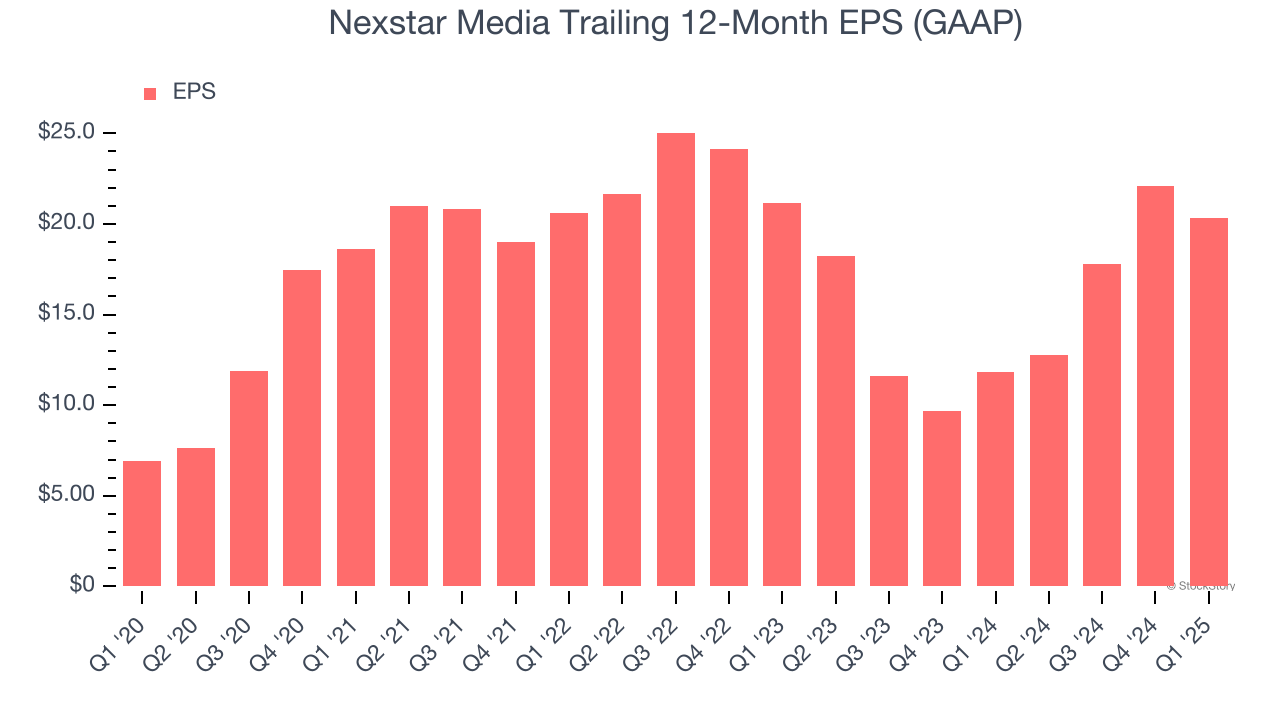
In Q1, Nexstar Media reported EPS at $3.37, down from $5.14 in the same quarter last year. Despite falling year on year, this print beat analysts’ estimates by 8.4%. Over the next 12 months, Wall Street expects Nexstar Media’s full-year EPS of $20.34 to shrink by 28.7%.
Key Takeaways from Nexstar Media’s Q1 Results
It was encouraging to see Nexstar Media beat analysts’ revenue, EPS, and EBITDA expectations this quarter. Overall, this print had some key positives. The stock traded up 5.4% to $164.48 immediately following the results.
Is Nexstar Media an attractive investment opportunity right now? We think that the latest quarter is only one piece of the longer-term business quality puzzle. Quality, when combined with valuation, can help determine if the stock is a buy. We cover that in our actionable full research report which you can read here, it’s free.