Environmental waste treatment and services provider Perma-Fix (NASDAQ: PESI) fell short of the market’s revenue expectations in Q1 CY2025 as sales rose 2.2% year on year to $13.92 million. Its GAAP loss of $0.19 per share was 35.7% below analysts’ consensus estimates.
Is now the time to buy Perma-Fix? Find out by accessing our full research report, it’s free.
Perma-Fix (PESI) Q1 CY2025 Highlights:
- Revenue: $13.92 million vs analyst estimates of $15.3 million (2.2% year-on-year growth, 9% miss)
- EPS (GAAP): -$0.19 vs analyst expectations of -$0.14 (35.7% miss)
- Adjusted EBITDA: -$3.27 million vs analyst estimates of -$2 million (-23.5% margin, 63.4% miss)
- Operating Margin: -26.8%, up from -32.8% in the same quarter last year
- Market Capitalization: $162.6 million
"Our first quarter results reflect the impact of several transitional headwinds," said Mark Duff, President and Chief Executive Officer of Perma-Fix Environmental Services.
Company Overview
Tackling hazardous waste challenges since 1990, Perma-Fix (NASDAQ: PESI) provides environmental waste treatment services.
Sales Growth
Reviewing a company’s long-term sales performance reveals insights into its quality. Any business can experience short-term success, but top-performing ones enjoy sustained growth for years. Perma-Fix struggled to consistently generate demand over the last five years as its sales dropped at a 7.3% annual rate. This was below our standards and suggests it’s a low quality business.
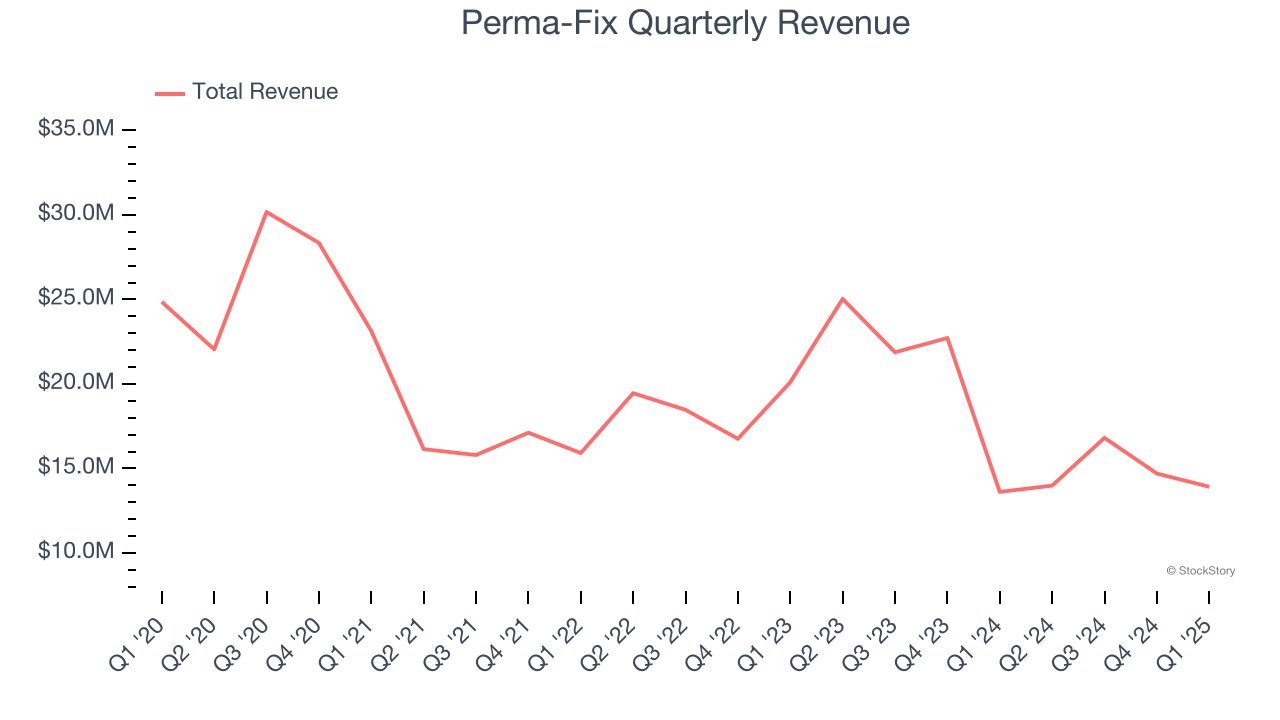
We at StockStory place the most emphasis on long-term growth, but within industrials, a half-decade historical view may miss cycles, industry trends, or a company capitalizing on catalysts such as a new contract win or a successful product line. Perma-Fix’s recent performance shows its demand remained suppressed as its revenue has declined by 10.9% annually over the last two years. 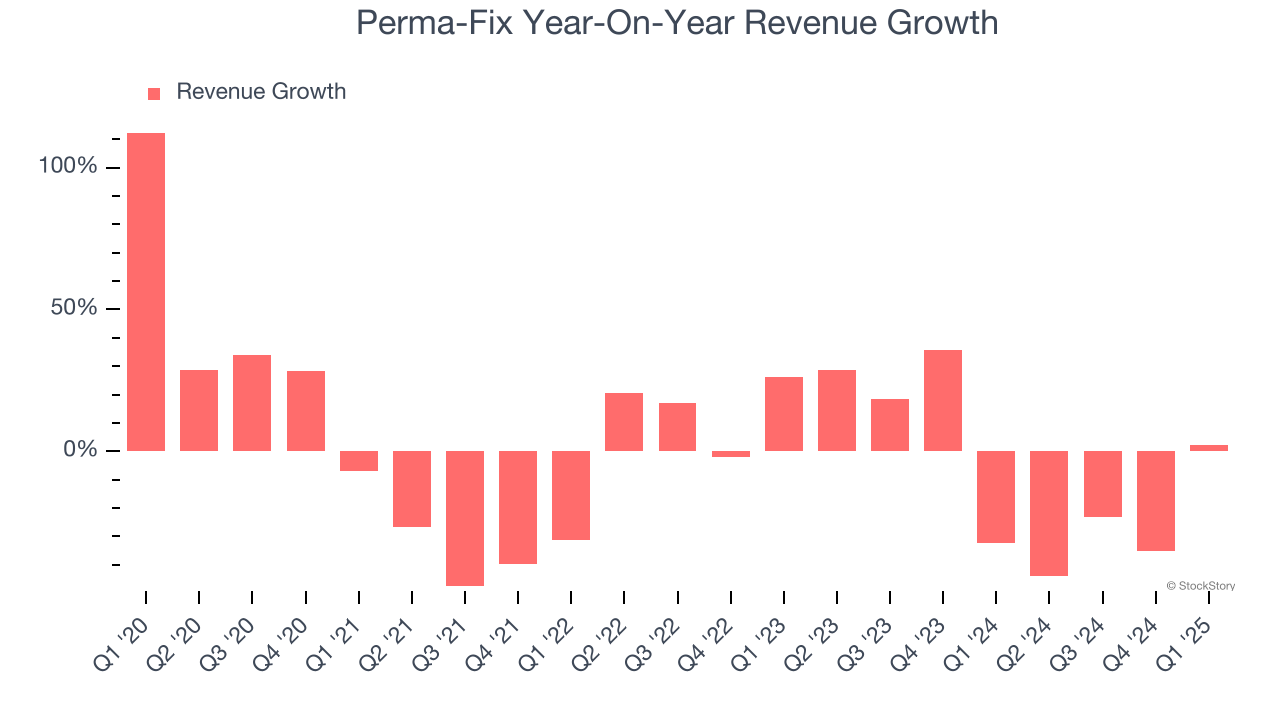
This quarter, Perma-Fix’s revenue grew by 2.2% year on year to $13.92 million, falling short of Wall Street’s estimates.
Looking ahead, sell-side analysts expect revenue to grow 62.1% over the next 12 months, an improvement versus the last two years. This projection is eye-popping and implies its newer products and services will spur better top-line performance.
Today’s young investors won’t have read the timeless lessons in Gorilla Game: Picking Winners In High Technology because it was written more than 20 years ago when Microsoft and Apple were first establishing their supremacy. But if we apply the same principles, then enterprise software stocks leveraging their own generative AI capabilities may well be the Gorillas of the future. So, in that spirit, we are excited to present our Special Free Report on a profitable, fast-growing enterprise software stock that is already riding the automation wave and looking to catch the generative AI next.
Operating Margin
Operating margin is one of the best measures of profitability because it tells us how much money a company takes home after procuring and manufacturing its products, marketing and selling those products, and most importantly, keeping them relevant through research and development.
Perma-Fix’s high expenses have contributed to an average operating margin of negative 7.5% over the last five years. Unprofitable industrials companies require extra attention because they could get caught swimming naked when the tide goes out. It’s hard to trust that the business can endure a full cycle.
Looking at the trend in its profitability, Perma-Fix’s operating margin decreased by 26 percentage points over the last five years. Perma-Fix’s performance was poor no matter how you look at it - it shows that costs were rising and it couldn’t pass them onto its customers.
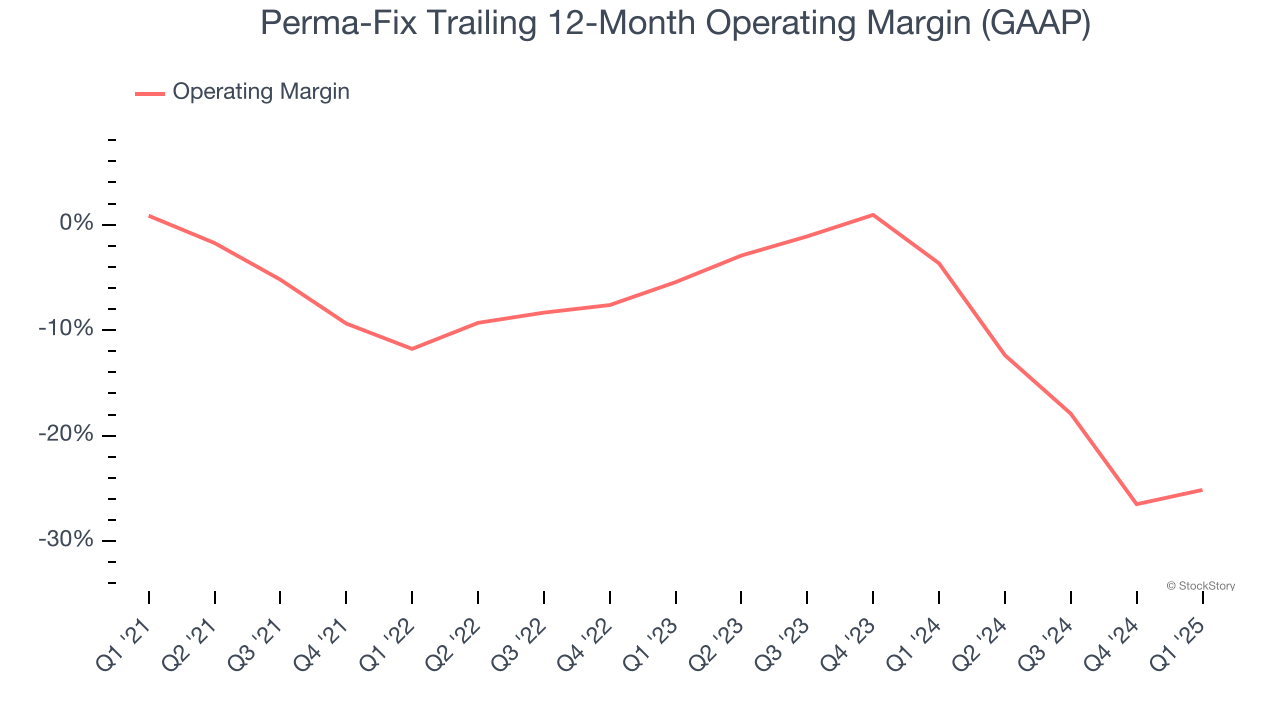
Perma-Fix’s operating margin was negative 26.8% this quarter. The company's consistent lack of profits raise a flag.
Earnings Per Share
We track the long-term change in earnings per share (EPS) for the same reason as long-term revenue growth. Compared to revenue, however, EPS highlights whether a company’s growth is profitable.
Sadly for Perma-Fix, its EPS declined by 41.3% annually over the last five years, more than its revenue. This tells us the company struggled because its fixed cost base made it difficult to adjust to shrinking demand.
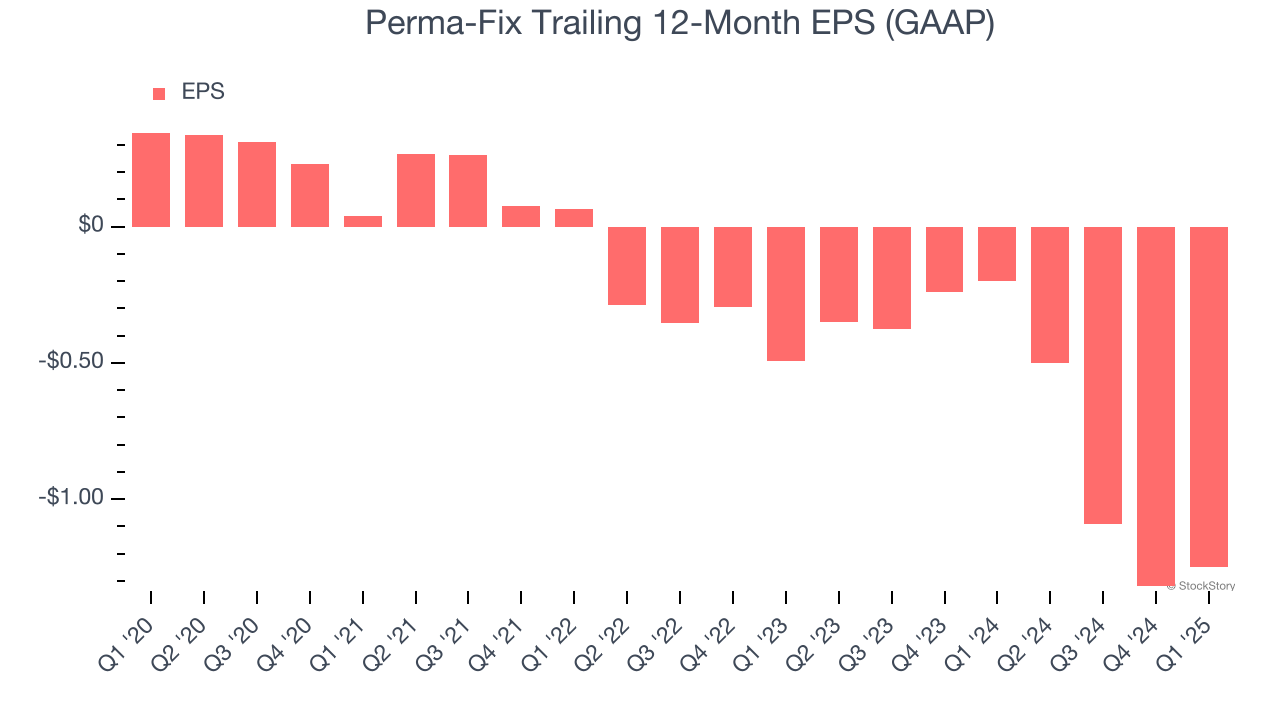
Diving into the nuances of Perma-Fix’s earnings can give us a better understanding of its performance. As we mentioned earlier, Perma-Fix’s operating margin improved this quarter but declined by 26 percentage points over the last five years. Its share count also grew by 49.2%, meaning the company not only became less efficient with its operating expenses but also diluted its shareholders. 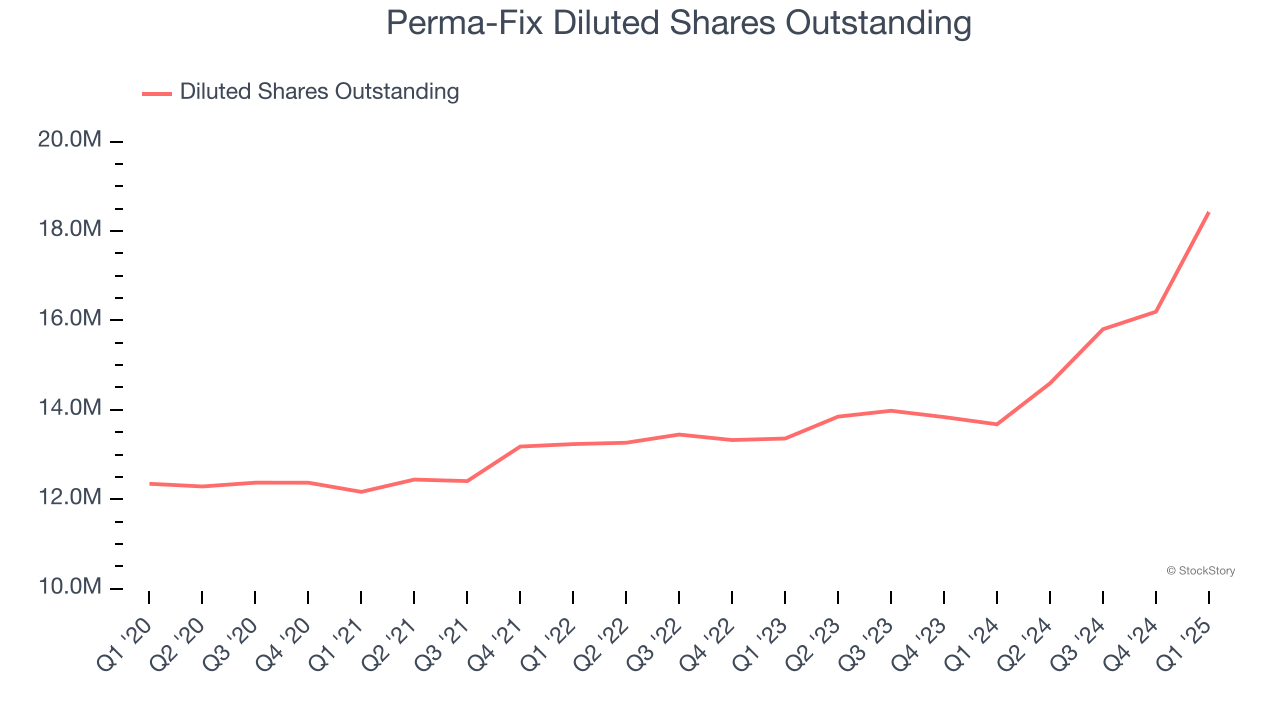
Like with revenue, we analyze EPS over a more recent period because it can provide insight into an emerging theme or development for the business.
For Perma-Fix, its two-year annual EPS declines of 59.2% show it’s continued to underperform. These results were bad no matter how you slice the data.
In Q1, Perma-Fix reported EPS at negative $0.19, up from negative $0.26 in the same quarter last year. Despite growing year on year, this print missed analysts’ estimates. Over the next 12 months, Wall Street is optimistic. Analysts forecast Perma-Fix’s full-year EPS of negative $1.25 will reach break even.
Key Takeaways from Perma-Fix’s Q1 Results
We struggled to find many positives in these results. Its revenue missed significantly and its EBITDA fell short of Wall Street’s estimates. Overall, this was a softer quarter. The stock traded down 3.6% to $8.53 immediately following the results.
Perma-Fix may have had a tough quarter, but does that actually create an opportunity to invest right now? We think that the latest quarter is only one piece of the longer-term business quality puzzle. Quality, when combined with valuation, can help determine if the stock is a buy. We cover that in our actionable full research report which you can read here, it’s free.