Content production and distribution company Sphere Entertainment (NYSE: SPHR) met Wall Street’s revenue expectations in Q1 CY2025, but sales fell by 12.7% year on year to $280.6 million. Its GAAP loss of $2.27 per share was 24.3% above analysts’ consensus estimates.
Is now the time to buy Sphere Entertainment? Find out by accessing our full research report, it’s free.
Sphere Entertainment (SPHR) Q1 CY2025 Highlights:
- Revenue: $280.6 million vs analyst estimates of $279.8 million (12.7% year-on-year decline, in line)
- EPS (GAAP): -$2.27 vs analyst estimates of -$3 (24.3% beat)
- Operating Margin: -28%, down from -12.6% in the same quarter last year
- Market Capitalization: $1.07 billion
Executive Chairman and CEO James L. Dolan said, "Our Sphere segment generated positive adjusted operating income in the first quarter as we make progress on our strategic priorities for the business. We remain confident in the opportunities ahead for Sphere and our ability to drive growth this calendar year."
Company Overview
Famous for its viral Las Vegas Sphere venue, Sphere Entertainment (NYSE: SPHR) hosts live entertainment events and distributes content across various media platforms.
Sales Growth
Reviewing a company’s long-term sales performance reveals insights into its quality. Even a bad business can shine for one or two quarters, but a top-tier one grows for years. Over the last five years, Sphere Entertainment grew its sales at a weak 2.4% compounded annual growth rate. This was below our standards and is a poor baseline for our analysis.
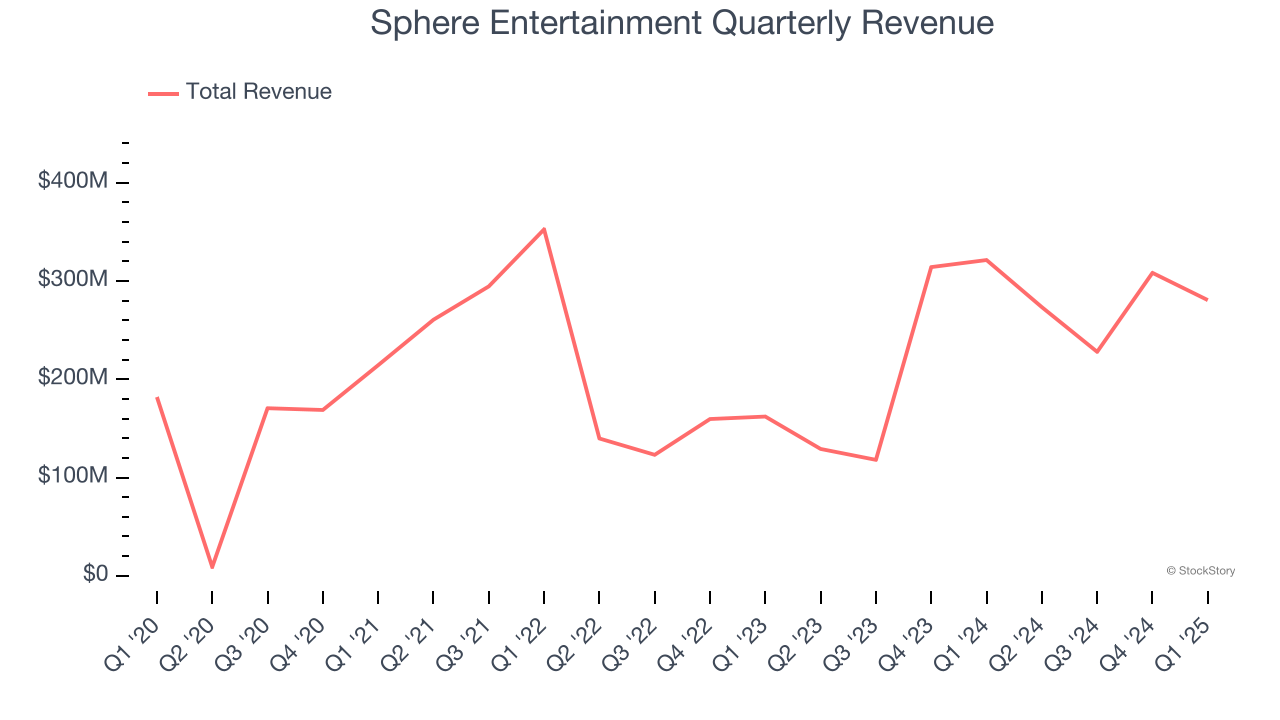
Long-term growth is the most important, but within consumer discretionary, product cycles are short and revenue can be hit-driven due to rapidly changing trends and consumer preferences. Sphere Entertainment’s annualized revenue growth of 36.6% over the last two years is above its five-year trend, suggesting its demand recently accelerated. Note that COVID hurt Sphere Entertainment’s business in 2020 and part of 2021, and it bounced back in a big way thereafter. 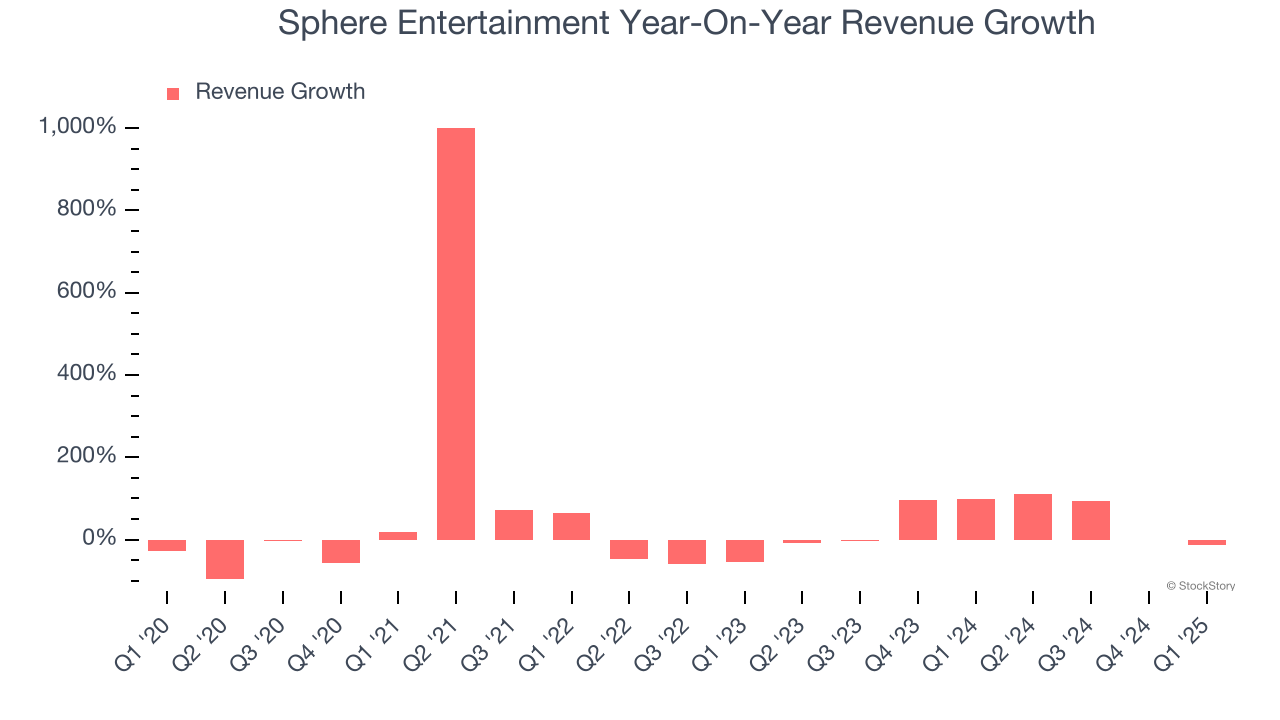
We can better understand the company’s revenue dynamics by analyzing its most important segments, Sphere and MSG Networks, which are 56.1% and 43.8% of revenue. Over the last two years, Sphere Entertainment’s Sphere revenue (live events and advertising) averaged 9,691% year-on-year growth. On the other hand, its MSG Networks revenue (content distribution) averaged 8.6% declines.
This quarter, Sphere Entertainment reported a rather uninspiring 12.7% year-on-year revenue decline to $280.6 million of revenue, in line with Wall Street’s estimates.
Looking ahead, sell-side analysts expect revenue to grow 10.5% over the next 12 months, a deceleration versus the last two years. This projection is underwhelming and indicates its products and services will face some demand challenges.
Here at StockStory, we certainly understand the potential of thematic investing. Diverse winners from Microsoft (MSFT) to Alphabet (GOOG), Coca-Cola (KO) to Monster Beverage (MNST) could all have been identified as promising growth stories with a megatrend driving the growth. So, in that spirit, we’ve identified a relatively under-the-radar profitable growth stock benefiting from the rise of AI, available to you FREE via this link.
Operating Margin
Operating margin is an important measure of profitability as it shows the portion of revenue left after accounting for all core expenses – everything from the cost of goods sold to advertising and wages. It’s also useful for comparing profitability across companies with different levels of debt and tax rates because it excludes interest and taxes.
Sphere Entertainment’s operating margin might fluctuated slightly over the last 12 months but has remained more or less the same, averaging negative 38.1% over the last two years. Unprofitable consumer discretionary companies that fail to improve their losses or grow sales rapidly deserve extra scrutiny. For the time being, it’s unclear if Sphere Entertainment’s business model is sustainable.
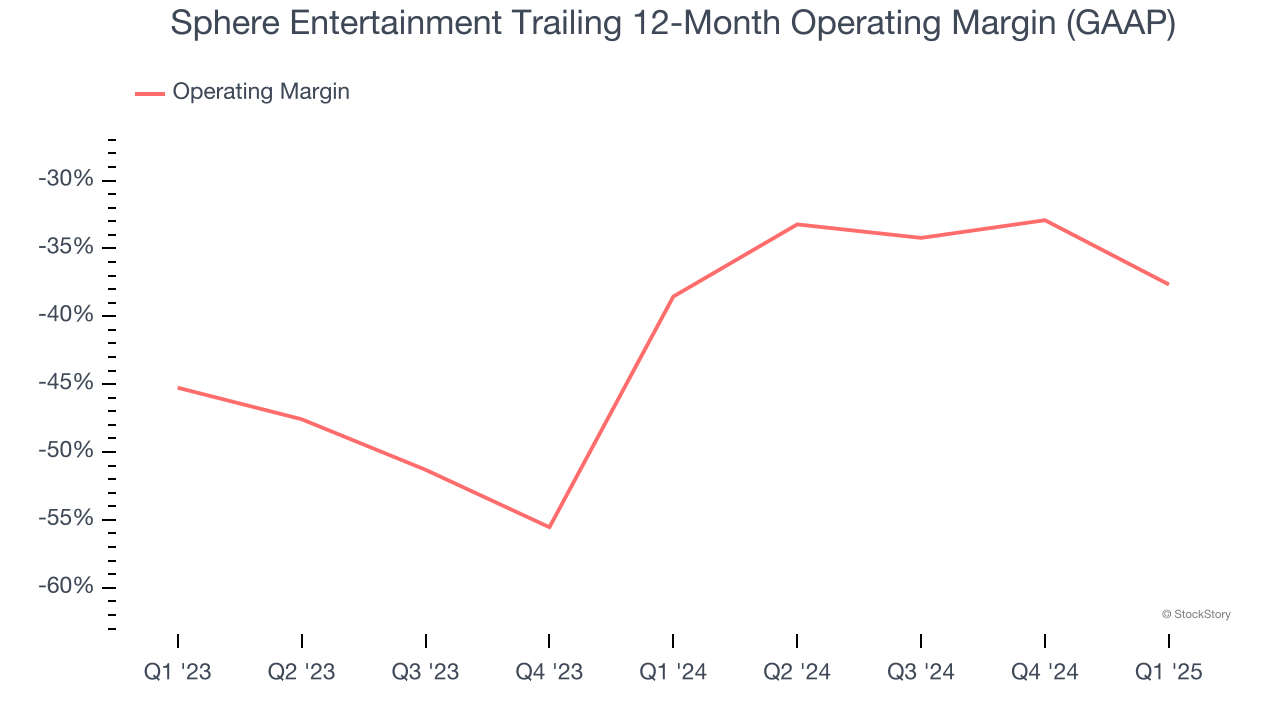
Sphere Entertainment’s operating margin was negative 28% this quarter. The company's consistent lack of profits raise a flag.
Earnings Per Share
We track the long-term change in earnings per share (EPS) for the same reason as long-term revenue growth. Compared to revenue, however, EPS highlights whether a company’s growth is profitable.
Sphere Entertainment’s earnings losses deepened over the last five years as its EPS dropped 3% annually. We tend to steer our readers away from companies with falling EPS, where diminishing earnings could imply changing secular trends and preferences. Consumer Discretionary companies are particularly exposed to this, and if the tide turns unexpectedly, Sphere Entertainment’s low margin of safety could leave its stock price susceptible to large downswings.
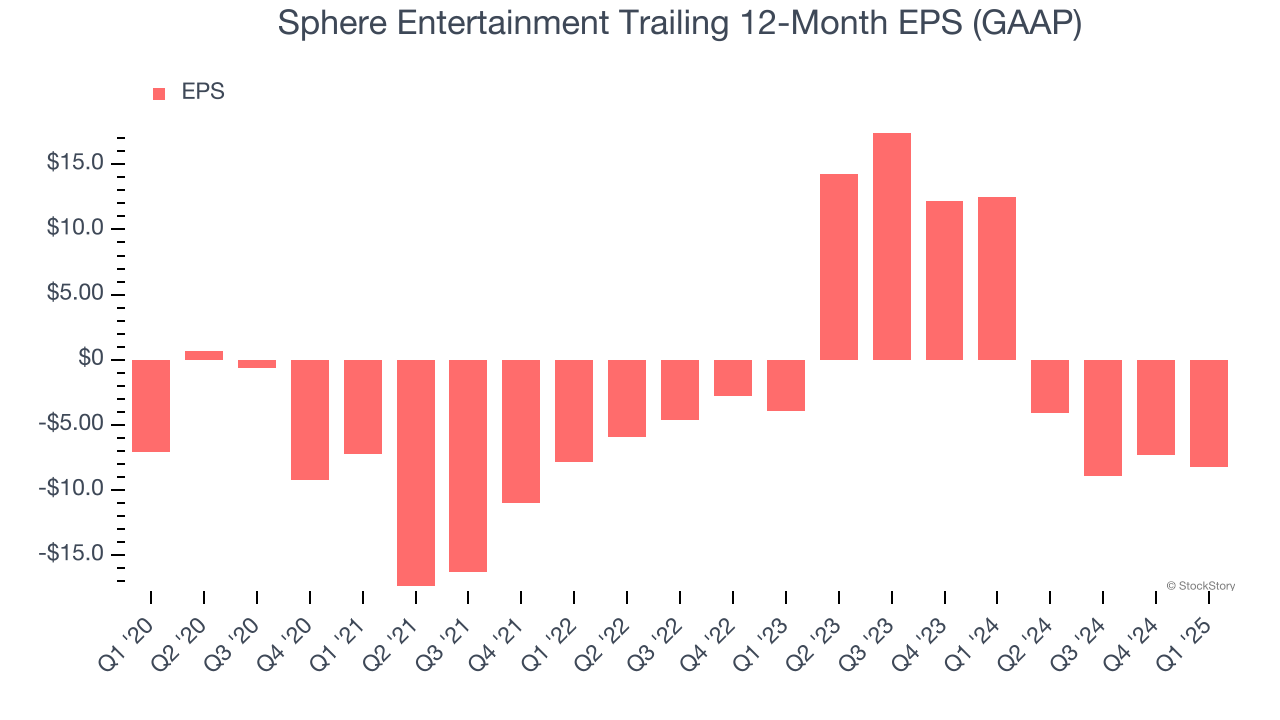
In Q1, Sphere Entertainment reported EPS at negative $2.27, down from negative $1.33 in the same quarter last year. Despite falling year on year, this print easily cleared analysts’ estimates. Over the next 12 months, Wall Street expects Sphere Entertainment to improve its earnings losses. Analysts forecast its full-year EPS of negative $8.23 will advance to negative $7.52.
Key Takeaways from Sphere Entertainment’s Q1 Results
We enjoyed seeing Sphere Entertainment beat analysts’ EPS expectations this quarter. Overall, this was a solid quarter. The stock traded up 4.3% to $31 immediately following the results.
Big picture, is Sphere Entertainment a buy here and now? The latest quarter does matter, but not nearly as much as longer-term fundamentals and valuation, when deciding if the stock is a buy. We cover that in our actionable full research report which you can read here, it’s free.