
Broadcasting and digital media company TEGNA (NYSE: TGNA) met Wall Street’s revenue expectations in Q1 CY2025, but sales fell by 4.8% year on year to $680 million. On the other hand, next quarter’s revenue guidance of $671.3 million was less impressive, coming in 0.6% below analysts’ estimates. Its non-GAAP profit of $0.37 per share was 12.9% above analysts’ consensus estimates.
Is now the time to buy TEGNA? Find out by accessing our full research report, it’s free.
TEGNA (TGNA) Q1 CY2025 Highlights:
- Revenue: $680 million vs analyst estimates of $676.7 million (4.8% year-on-year decline, in line)
- Adjusted EPS: $0.37 vs analyst estimates of $0.33 (12.9% beat)
- Adjusted EBITDA: $136.2 million vs analyst estimates of $130.8 million (20% margin, 4.1% beat)
- Revenue Guidance for Q2 CY2025 is $671.3 million at the midpoint, below analyst estimates of $675.5 million
- Operating Margin: 16%, down from 19.3% in the same quarter last year
- Free Cash Flow Margin: 8%, down from 13.4% in the same quarter last year
- Market Capitalization: $2.68 billion
“We’re making important progress on the key initiatives that are shaping TEGNA’s future,” said Mike Steib, CEO.
Company Overview
Spun out of Gannett in 2015, TEGNA (NYSE: TGNA) is a media company operating a network of television stations and digital platforms, focusing on local news and community content.
Sales Growth
A company’s long-term sales performance can indicate its overall quality. Any business can put up a good quarter or two, but many enduring ones grow for years. Unfortunately, TEGNA’s 4.5% annualized revenue growth over the last five years was sluggish. This was below our standard for the consumer discretionary sector and is a tough starting point for our analysis.
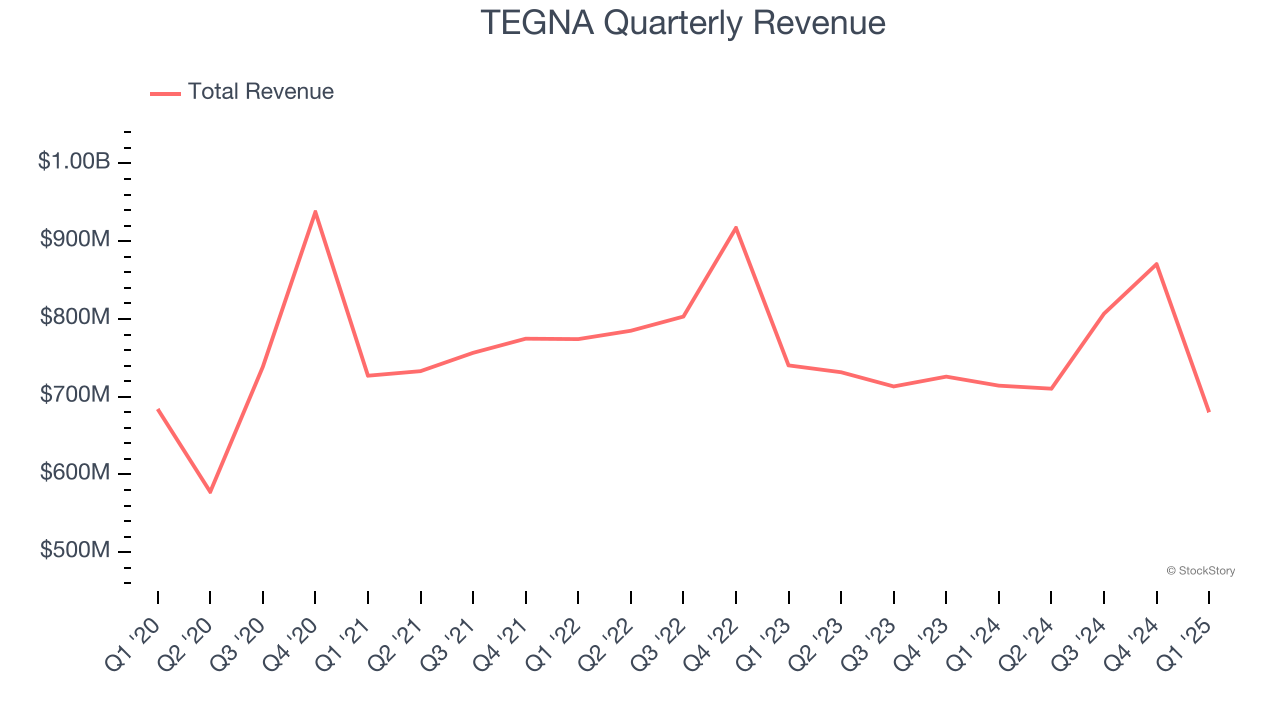
We at StockStory place the most emphasis on long-term growth, but within consumer discretionary, a stretched historical view may miss a company riding a successful new product or trend. TEGNA’s performance shows it grew in the past but relinquished its gains over the last two years, as its revenue fell by 2.8% annually. 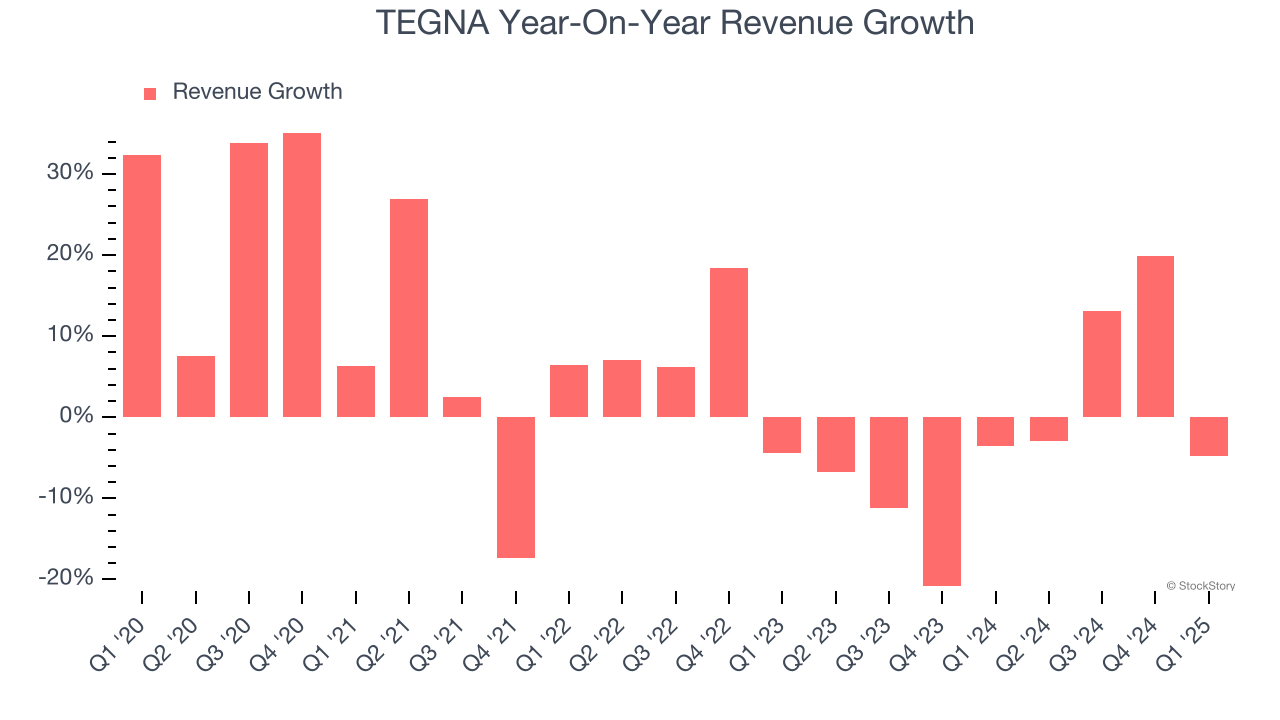
We can dig further into the company’s revenue dynamics by analyzing its most important segments, Subscription and Advertising, which are 55.8% and 42.1% of revenue. Over the last two years, TEGNA’s Subscription revenue (access to content) averaged 2.9% year-on-year declines while its Advertising revenue (marketing services) averaged 3.9% declines.
This quarter, TEGNA reported a rather uninspiring 4.8% year-on-year revenue decline to $680 million of revenue, in line with Wall Street’s estimates. Company management is currently guiding for a 5.5% year-on-year decline in sales next quarter.
Looking further ahead, sell-side analysts expect revenue to decline by 9.1% over the next 12 months, a deceleration versus the last two years. This projection is underwhelming and indicates its products and services will face some demand challenges.
Today’s young investors won’t have read the timeless lessons in Gorilla Game: Picking Winners In High Technology because it was written more than 20 years ago when Microsoft and Apple were first establishing their supremacy. But if we apply the same principles, then enterprise software stocks leveraging their own generative AI capabilities may well be the Gorillas of the future. So, in that spirit, we are excited to present our Special Free Report on a profitable, fast-growing enterprise software stock that is already riding the automation wave and looking to catch the generative AI next.
Operating Margin
TEGNA’s operating margin might fluctuated slightly over the last 12 months but has generally stayed the same, averaging 24.4% over the last two years. This profitability was elite for a consumer discretionary business thanks to its efficient cost structure and economies of scale.
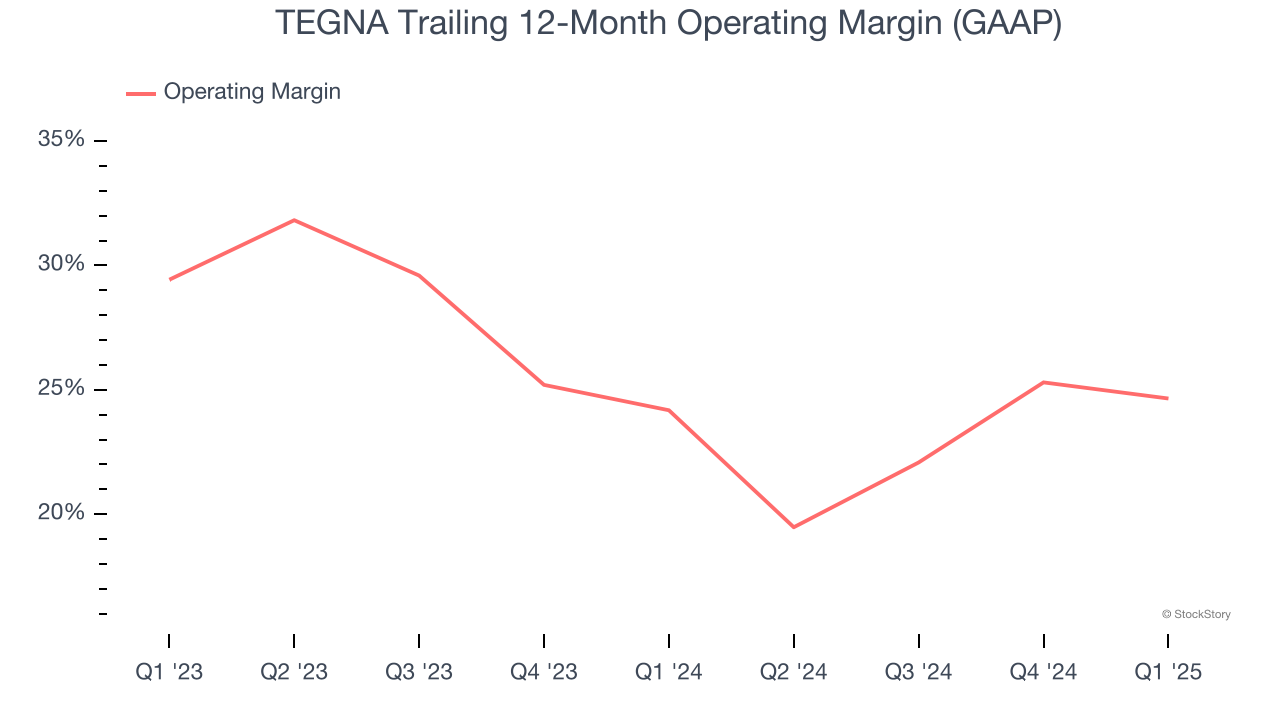
In Q1, TEGNA generated an operating profit margin of 16%, down 3.2 percentage points year on year. This contraction shows it was less efficient because its expenses increased relative to its revenue.
Earnings Per Share
We track the long-term change in earnings per share (EPS) for the same reason as long-term revenue growth. Compared to revenue, however, EPS highlights whether a company’s growth is profitable.
TEGNA’s EPS grew at a solid 15.5% compounded annual growth rate over the last five years, higher than its 4.5% annualized revenue growth. However, this alone doesn’t tell us much about its business quality because its operating margin didn’t expand.
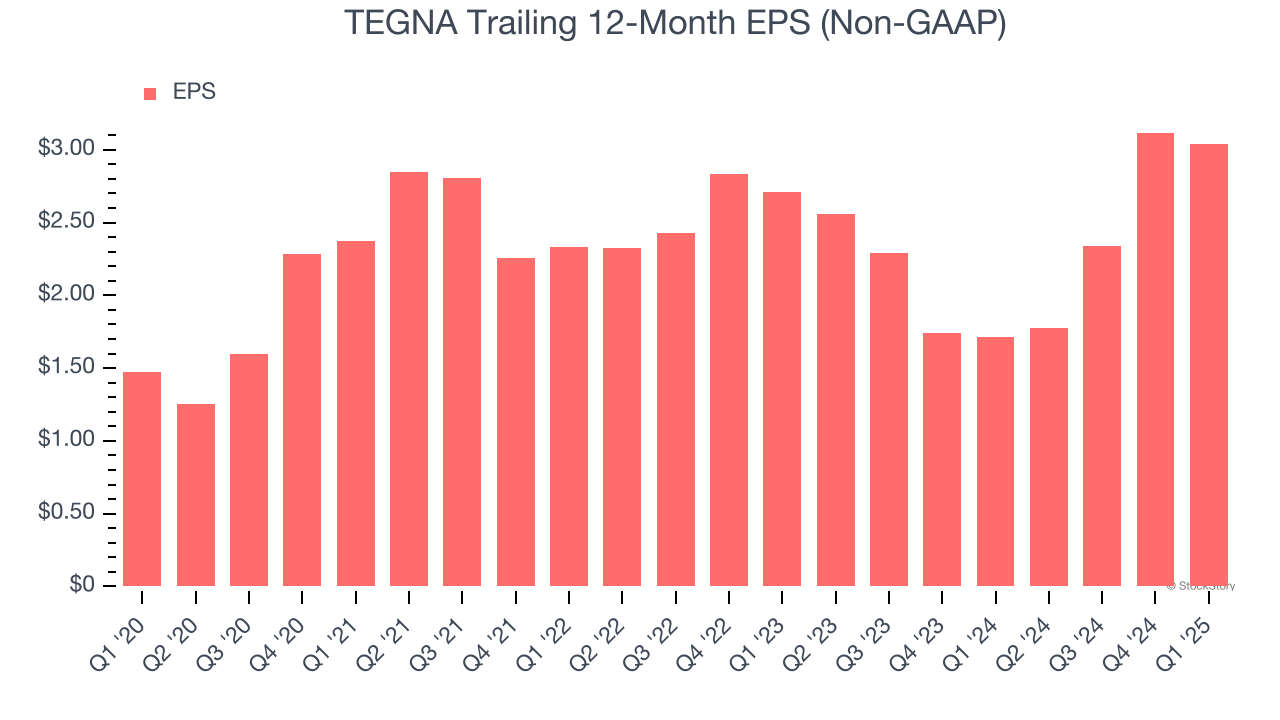
In Q1, TEGNA reported EPS at $0.37, down from $0.45 in the same quarter last year. Despite falling year on year, this print easily cleared analysts’ estimates. Over the next 12 months, Wall Street expects TEGNA’s full-year EPS of $3.04 to shrink by 31.5%.
Key Takeaways from TEGNA’s Q1 Results
It was encouraging to see TEGNA beat analysts’ EPS expectations this quarter. We were also happy its EBITDA outperformed Wall Street’s estimates. On the other hand, its Subscription revenue missed. Overall, this print had some key positives. The stock remained flat at $16.80 immediately after reporting.
Should you buy the stock or not? If you’re making that decision, you should consider the bigger picture of valuation, business qualities, as well as the latest earnings. We cover that in our actionable full research report which you can read here, it’s free.