REV Group currently trades at $35.80 and has been a dream stock for shareholders. It’s returned 605% since May 2020, blowing past the S&P 500’s 92.9% gain. The company has also beaten the index over the past six months as its stock price is up 16.2% thanks to its solid quarterly results.
Is now the time to buy REV Group, or should you be careful about including it in your portfolio? See what our analysts have to say in our full research report, it’s free.
Why Is REV Group Not Exciting?
We’re glad investors have benefited from the price increase, but we're sitting this one out for now. Here are three reasons why there are better opportunities than REVG and a stock we'd rather own.
1. Long-Term Revenue Growth Flatter Than a Pancake
A company’s long-term sales performance is one signal of its overall quality. Any business can put up a good quarter or two, but many enduring ones grow for years. Unfortunately, REV Group struggled to consistently increase demand as its $2.32 billion of sales for the trailing 12 months was close to its revenue five years ago. This wasn’t a great result and signals it’s a lower quality business. 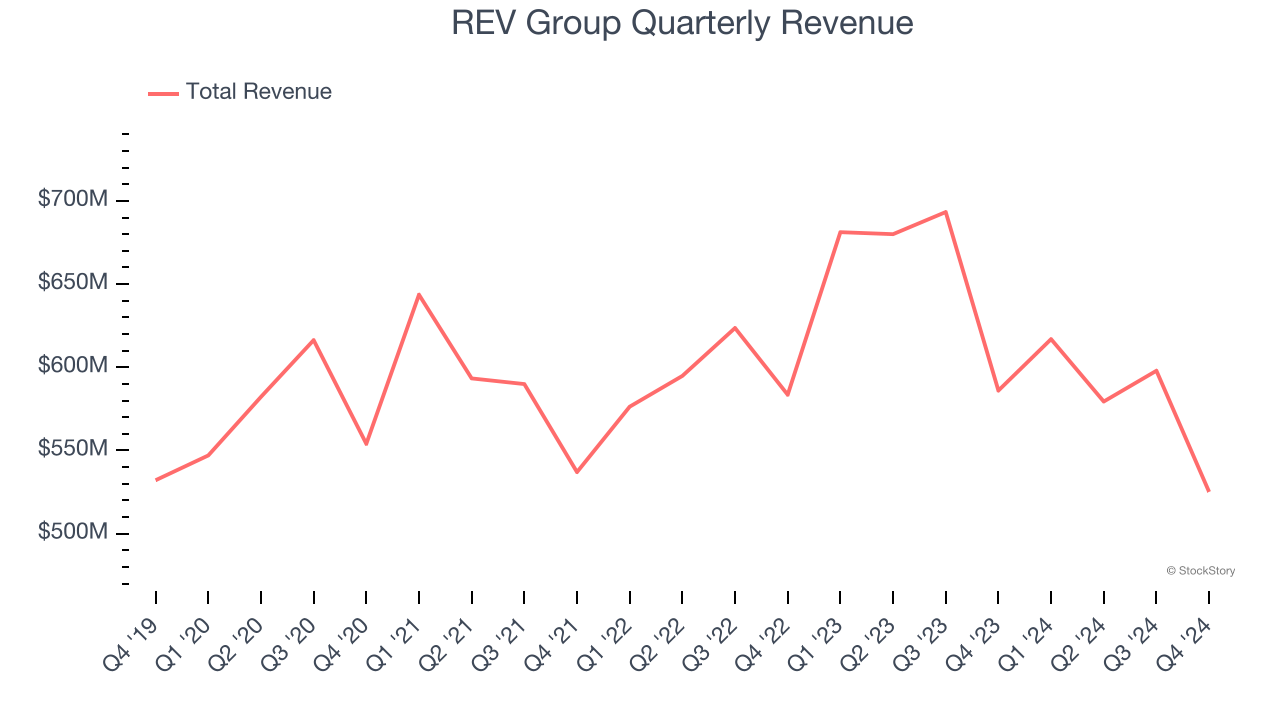
2. Low Gross Margin Reveals Weak Structural Profitability
All else equal, we prefer higher gross margins because they usually indicate that a company sells more differentiated products and commands stronger pricing power.
REV Group has bad unit economics for an industrials business, signaling it operates in a competitive market. As you can see below, it averaged a 11.7% gross margin over the last five years. Said differently, REV Group had to pay a chunky $88.31 to its suppliers for every $100 in revenue. 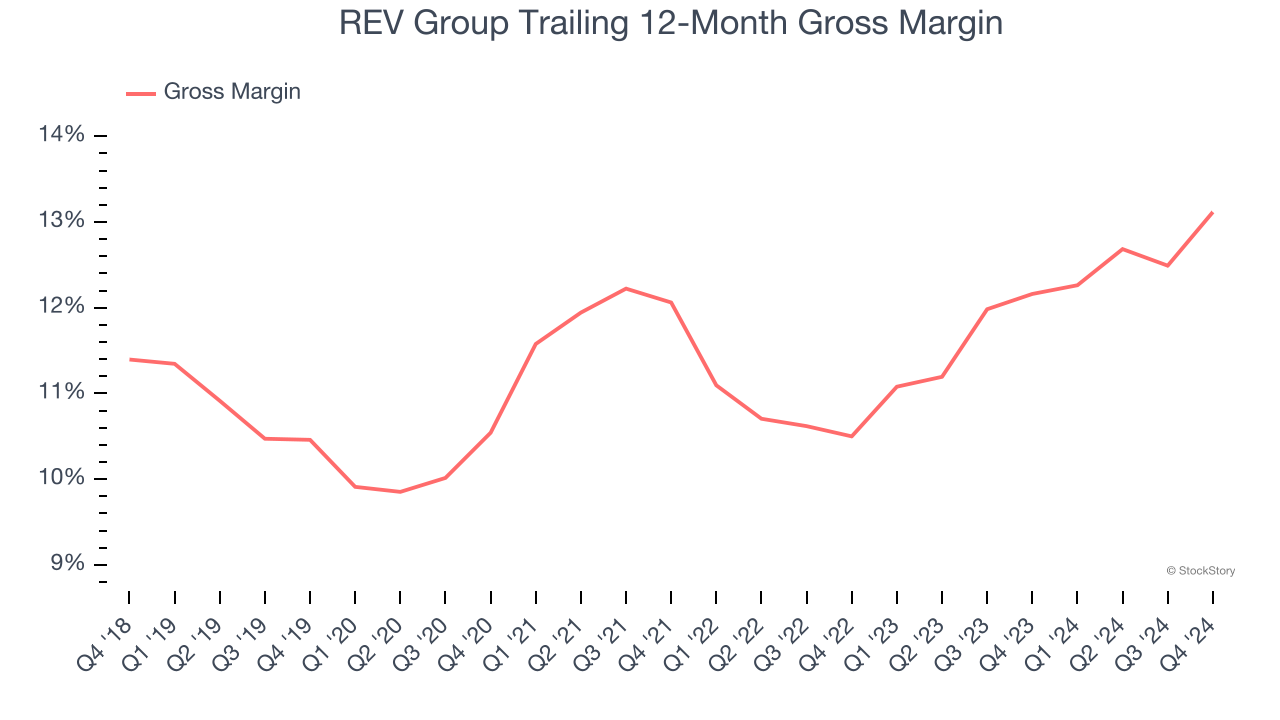
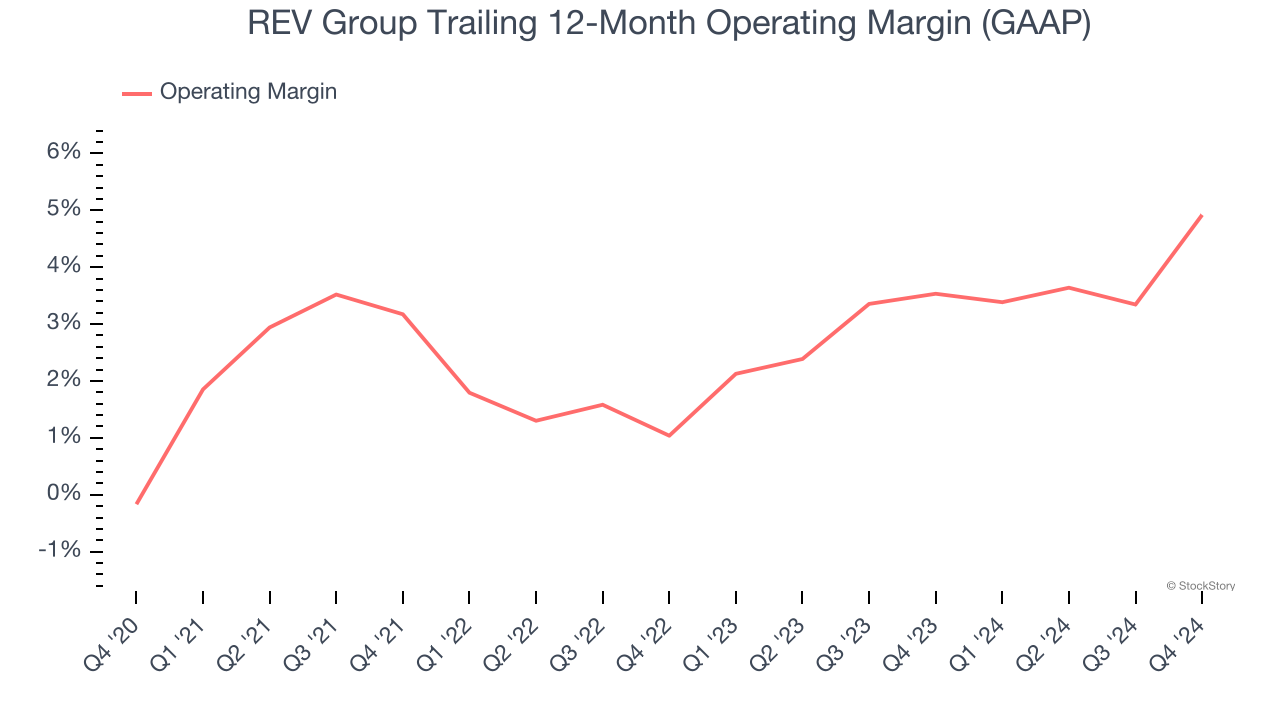
3. Weak Operating Margin Could Cause Trouble
Operating margin is a key measure of profitability. Think of it as net income - the bottom line - excluding the impact of taxes and interest on debt, which are less connected to business fundamentals.
REV Group was profitable over the last five years but held back by its large cost base. Its average operating margin of 2.5% was weak for an industrials business. This result isn’t too surprising given its low gross margin as a starting point.
Final Judgment
REV Group’s business quality ultimately falls short of our standards. With its shares topping the market in recent months, the stock trades at 14.2× forward P/E (or $35.80 per share). Beauty is in the eye of the beholder, but our analysis shows the upside isn’t great compared to the potential downside. We're pretty confident there are superior stocks to buy right now. We’d suggest looking at one of our all-time favorite software stocks.
Stocks We Would Buy Instead of REV Group
The market surged in 2024 and reached record highs after Donald Trump’s presidential victory in November, but questions about new economic policies are adding much uncertainty for 2025.
While the crowd speculates what might happen next, we’re homing in on the companies that can succeed regardless of the political or macroeconomic environment. Put yourself in the driver’s seat and build a durable portfolio by checking out our Top 6 Stocks for this week. This is a curated list of our High Quality stocks that have generated a market-beating return of 175% over the last five years.
Stocks that made our list in 2019 include now familiar names such as Nvidia (+2,183% between December 2019 and December 2024) as well as under-the-radar businesses like Sterling Infrastructure (+1,096% five-year return). Find your next big winner with StockStory today.