
Nu Skin currently trades at $7.96 per share and has shown little upside over the past six months, posting a middling return of 1.7%.
Is now the time to buy Nu Skin, or should you be careful about including it in your portfolio? See what our analysts have to say in our full research report, it’s free.
Why Is Nu Skin Not Exciting?
We're cautious about Nu Skin. Here are three reasons why you should be careful with NUS and a stock we'd rather own.
1. Revenue Spiraling Downwards
A company’s long-term performance is an indicator of its overall quality. Any business can put up a good quarter or two, but the best consistently grow over the long haul. Nu Skin’s demand was weak over the last three years as its sales fell at a 13.8% annual rate. This wasn’t a great result and is a sign of lacking business quality. 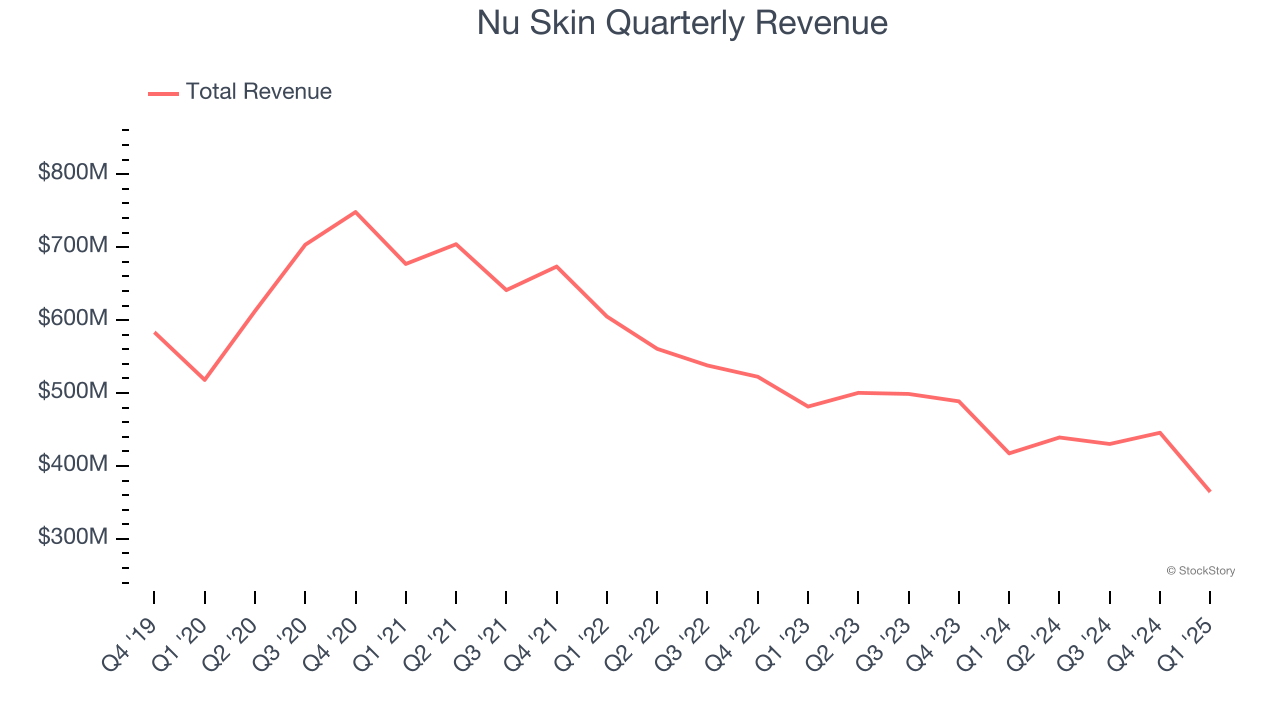
2. Fewer Distribution Channels Limit its Ceiling
With $1.68 billion in revenue over the past 12 months, Nu Skin is a small consumer staples company, which sometimes brings disadvantages compared to larger competitors benefiting from economies of scale and negotiating leverage with retailers.
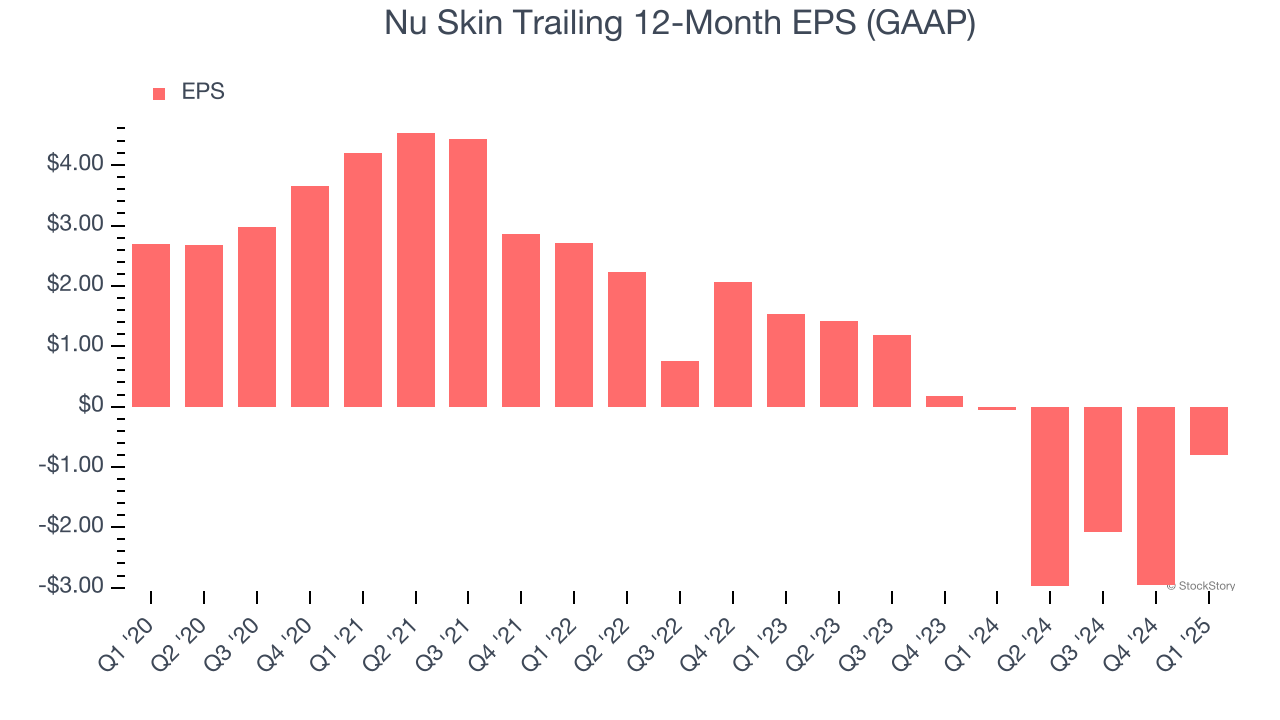
3. EPS Trending Down
We track the change in earnings per share (EPS) because it highlights whether a company’s growth is profitable.
Sadly for Nu Skin, its EPS declined by 31.9% annually over the last three years, more than its revenue. This tells us the company struggled because its fixed cost base made it difficult to adjust to shrinking demand.
Final Judgment
Nu Skin’s business quality ultimately falls short of our standards. That said, the stock currently trades at $7.96 per share (or a trailing 12-month price-to-sales ratio of 0.2×). The market typically values companies like Nu Skin based on their anticipated profits for the next 12 months, but there aren’t enough published estimates to arrive at a reliable number. You should avoid this stock for now - better opportunities lie elsewhere. We’d recommend looking at one of Charlie Munger’s all-time favorite businesses.
High-Quality Stocks for All Market Conditions
The market surged in 2024 and reached record highs after Donald Trump’s presidential victory in November, but questions about new economic policies are adding much uncertainty for 2025.
While the crowd speculates what might happen next, we’re homing in on the companies that can succeed regardless of the political or macroeconomic environment. Put yourself in the driver’s seat and build a durable portfolio by checking out our Top 5 Strong Momentum Stocks for this week. This is a curated list of our High Quality stocks that have generated a market-beating return of 183% over the last five years (as of March 31st 2025).
Stocks that made our list in 2020 include now familiar names such as Nvidia (+1,545% between March 2020 and March 2025) as well as under-the-radar businesses like the once-small-cap company Comfort Systems (+782% five-year return). Find your next big winner with StockStory today.
