Quarterly earnings results are a good time to check in on a company’s progress, especially compared to its peers in the same sector. Today we are looking at Macy's (NYSE: M) and the best and worst performers in the general merchandise retail industry.
General merchandise retailers–also called broadline retailers–know you’re busy and don’t want to drive around wasting time and gas, so they offer a one-stop shop. Convenience is the name of the game, so these stores may sell clothing in one section, toys in another, and home decor in a third. This concept has evolved over time from department stores to more niche concepts targeting bargain hunters or young adults, and e-commerce has forced these retailers to be extra sharp in their value propositions to consumers, whether that’s unique product or competitive prices.
The 8 general merchandise retail stocks we track reported a mixed Q1. As a group, revenues beat analysts’ consensus estimates by 1% while next quarter’s revenue guidance was 1.5% below.
In light of this news, share prices of the companies have held steady as they are up 1.7% on average since the latest earnings results.
Macy's (NYSE: M)
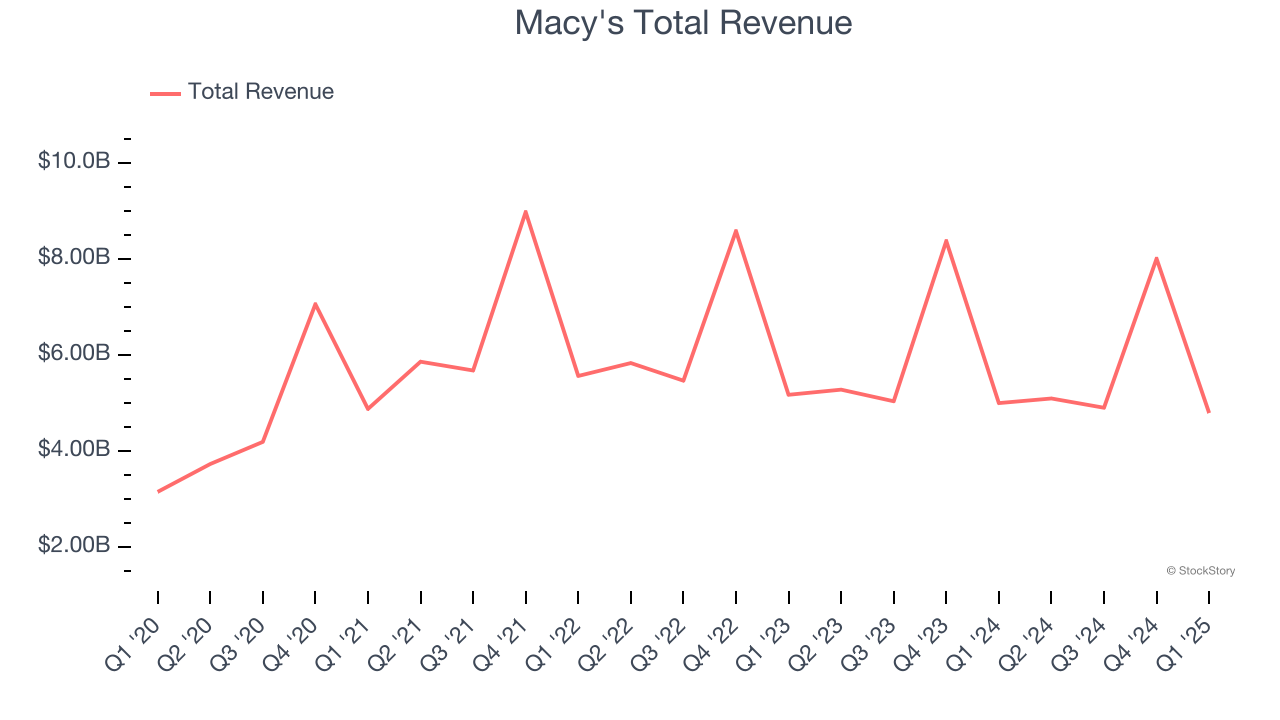
With a storied history that began with its 1858 founding, Macy’s (NYSE: M) is a department store chain that sells clothing, cosmetics, accessories, and home goods.
Macy's reported revenues of $4.79 billion, down 4.1% year on year. This print exceeded analysts’ expectations by 3.6%. Overall, it was a strong quarter for the company with an impressive beat of analysts’ gross margin estimates and a solid beat of analysts’ EBITDA estimates.
“We continued to execute against our Bold New Chapter strategy during the quarter, scaling key initiatives that improved our customer experience and contributed to stronger than expected performance across all three of our nameplates,” said Tony Spring, chairman and chief executive officer of Macy’s,
Macy's achieved the biggest analyst estimates beat and highest full-year guidance raise of the whole group. The results were likely priced in, however, and the stock is flat since reporting. It currently trades at $12.18.
Is now the time to buy Macy's? Access our full analysis of the earnings results here, it’s free.
Best Q1: Dillard's (NYSE: DDS)
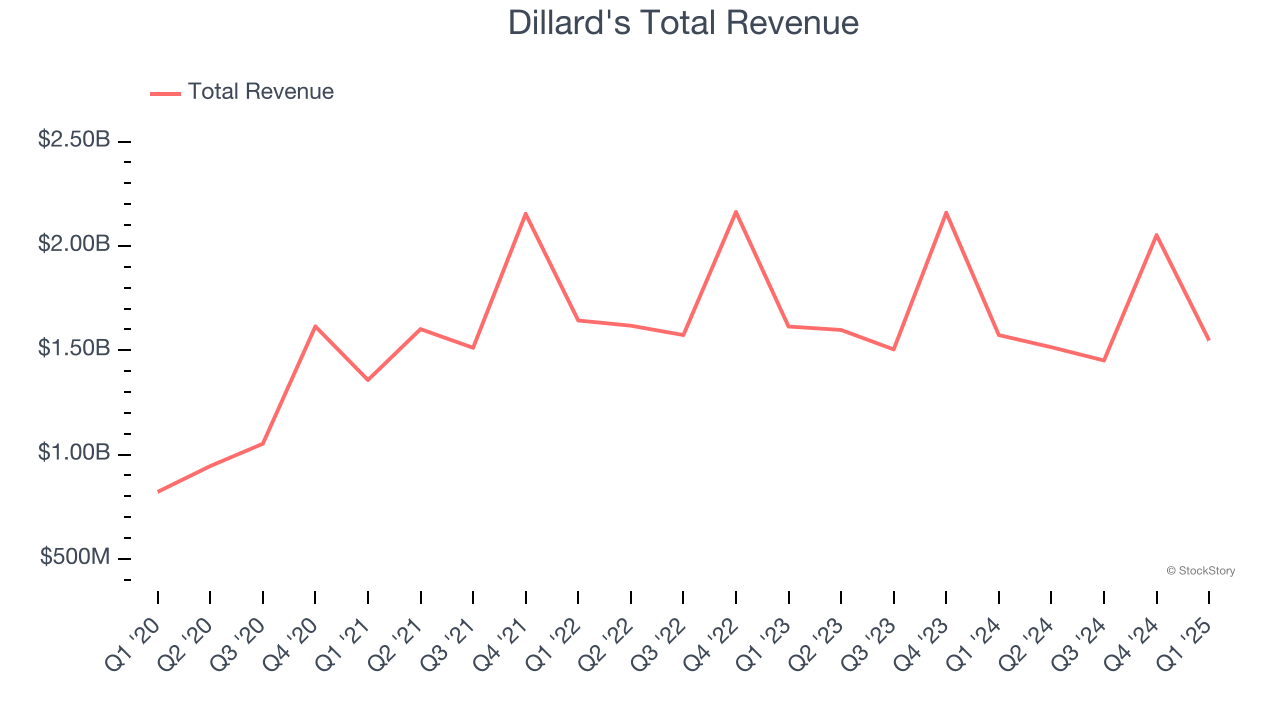
With stores located largely in the Southern and Western US, Dillard’s (NYSE: DDS) is a department store chain that sells clothing, cosmetics, accessories, and home goods.
Dillard's reported revenues of $1.55 billion, down 1.6% year on year, in line with analysts’ expectations. The business had a very strong quarter with an impressive beat of analysts’ EBITDA estimates and a solid beat of analysts’ EPS estimates.
The market seems content with the results as the stock is up 3.8% since reporting. It currently trades at $402.95.
Is now the time to buy Dillard's? Access our full analysis of the earnings results here, it’s free.
Weakest Q1: Burlington (NYSE: BURL)
Founded in 1972 as a discount coat and outerwear retailer, Burlington Stores (NYSE: BURL) is now an off-price retailer that has broadened into general apparel, footwear, and home goods.
Burlington reported revenues of $2.50 billion, up 6% year on year, falling short of analysts’ expectations by 0.9%. It was a slower quarter as it posted EPS guidance for next quarter missing analysts’ expectations.
Burlington delivered the weakest performance against analyst estimates in the group. Interestingly, the stock is up 3.3% since the results and currently trades at $246.94.
Read our full analysis of Burlington’s results here.
Ross Stores (NASDAQ: ROST)
Selling excess inventory or overstocked items from other retailers, Ross Stores (NASDAQ: ROST) is an off-price concept that sells apparel and other goods at prices much lower than department stores.
Ross Stores reported revenues of $4.98 billion, up 2.6% year on year. This print surpassed analysts’ expectations by 0.5%. Zooming out, it was a slower quarter as it produced EPS guidance for next quarter missing analysts’ expectations.
The stock is down 7.3% since reporting and currently trades at $141.01.
Read our full, actionable report on Ross Stores here, it’s free.
Kohl's (NYSE: KSS)
Founded as a corner grocery store in Milwaukee, Wisconsin, Kohl’s (NYSE: KSS) is a department store chain that sells clothing, cosmetics, electronics, and home goods.
Kohl's reported revenues of $3.23 billion, down 4.4% year on year. This number beat analysts’ expectations by 1%. It was a strong quarter as it also recorded an impressive beat of analysts’ EPS estimates and a solid beat of analysts’ gross margin estimates.
Kohl's had the slowest revenue growth among its peers. The stock is up 11% since reporting and currently trades at $9.02.
Read our full, actionable report on Kohl's here, it’s free.
Market Update
In response to the Fed’s rate hikes in 2022 and 2023, inflation has been gradually trending down from its post-pandemic peak, trending closer to the Fed’s 2% target. Despite higher borrowing costs, the economy has avoided flashing recessionary signals. This is the much-desired soft landing that many investors hoped for. The recent rate cuts (0.5% in September and 0.25% in November 2024) have bolstered the stock market, making 2024 a strong year for equities. Donald Trump’s presidential win in November sparked additional market gains, sending indices to record highs in the days following his victory. However, debates continue over possible tariffs and corporate tax adjustments, raising questions about economic stability in 2025.
Want to invest in winners with rock-solid fundamentals? Check out our 9 Best Market-Beating Stocks and add them to your watchlist. These companies are poised for growth regardless of the political or macroeconomic climate.