
Ford currently trades at $10.60 per share and has shown little upside over the past six months, posting a middling return of 1.8%.
Is there a buying opportunity in Ford, or does it present a risk to your portfolio? Dive into our full research report to see our analyst team’s opinion, it’s free.
Why Do We Think Ford Will Underperform?
We're swiping left on Ford for now. Here are three reasons why F doesn't excite us and a stock we'd rather own.
1. Sales Volumes Stall, Demand Waning
Revenue growth can be broken down into changes in price and volume (the number of units sold). While both are important, volume is the lifeblood of a successful Automobile Manufacturing company because there’s a ceiling to what customers will pay.
Over the last two years, Ford failed to grow its vehicles sold, which came in at 971,000 in the latest quarter. This performance was underwhelming and implies there may be increasing competition or market saturation. It also suggests Ford might have to lower prices or invest in product improvements to accelerate growth, factors that can hinder near-term profitability. 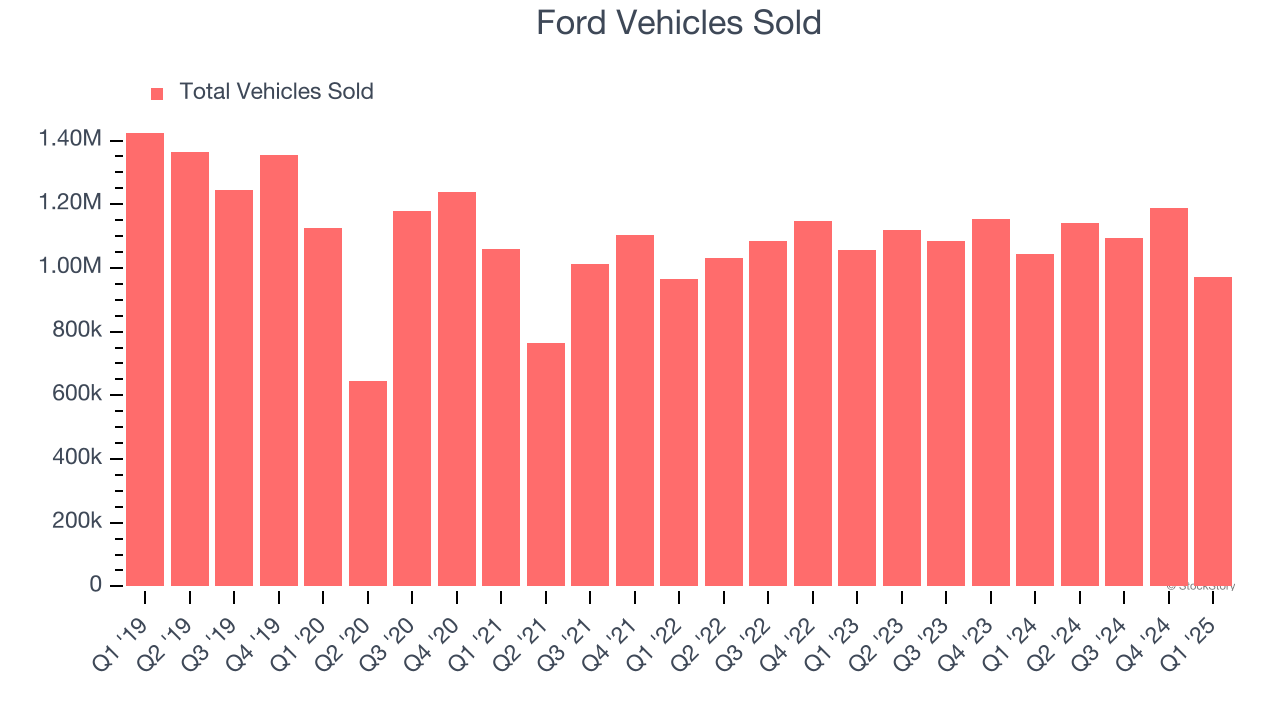
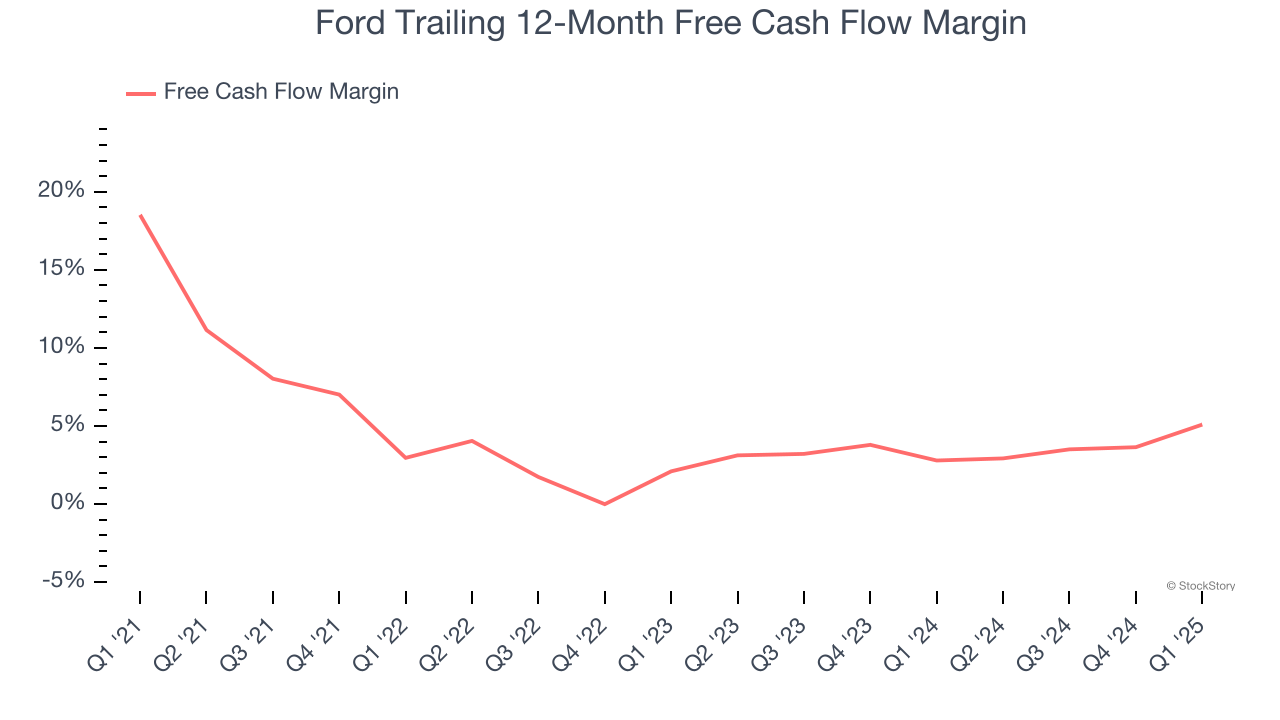
2. Free Cash Flow Margin Dropping
Free cash flow isn't a prominently featured metric in company financials and earnings releases, but we think it's telling because it accounts for all operating and capital expenses, making it tough to manipulate. Cash is king.
As you can see below, Ford’s margin dropped by 13.4 percentage points over the last five years. It may have ticked higher more recently, but shareholders are likely hoping for its margin to at least revert to its historical level. Almost any movement in the wrong direction is undesirable because of its relatively low cash conversion. If the longer-term trend returns, it could signal it’s becoming a more capital-intensive business. Ford’s free cash flow margin for the trailing 12 months was 5.1%.
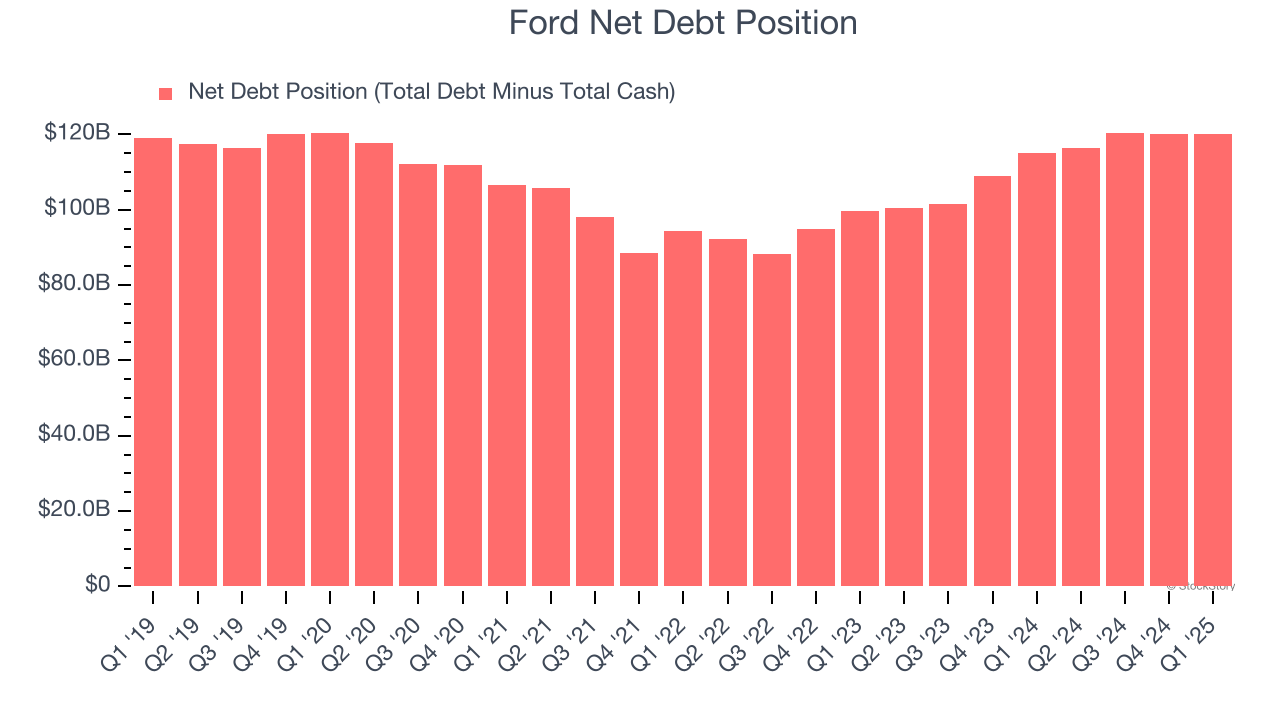
3. High Debt Levels Increase Risk
Debt is a tool that can boost company returns but presents risks if used irresponsibly. As long-term investors, we aim to avoid companies taking excessive advantage of this instrument because it could lead to insolvency.
Ford’s $155.3 billion of debt exceeds the $35.23 billion of cash on its balance sheet. Furthermore, its 8× net-debt-to-EBITDA ratio (based on its EBITDA of $14.21 billion over the last 12 months) shows the company is overleveraged.
At this level of debt, incremental borrowing becomes increasingly expensive and credit agencies could downgrade the company’s rating if profitability falls. Ford could also be backed into a corner if the market turns unexpectedly – a situation we seek to avoid as investors in high-quality companies.
We hope Ford can improve its balance sheet and remain cautious until it increases its profitability or pays down its debt.
Final Judgment
Ford falls short of our quality standards. That said, the stock currently trades at 7.8× forward P/E (or $10.60 per share). While this valuation is optically cheap, the potential downside is huge given its shaky fundamentals. There are better stocks to buy right now. We’d recommend looking at a top digital advertising platform riding the creator economy.
Stocks We Like More Than Ford
Market indices reached historic highs following Donald Trump’s presidential victory in November 2024, but the outlook for 2025 is clouded by new trade policies that could impact business confidence and growth.
While this has caused many investors to adopt a "fearful" wait-and-see approach, we’re leaning into our best ideas that can grow regardless of the political or macroeconomic climate. Take advantage of Mr. Market by checking out our Top 6 Stocks for this week. This is a curated list of our High Quality stocks that have generated a market-beating return of 183% over the last five years (as of March 31st 2025).
Stocks that made our list in 2020 include now familiar names such as Nvidia (+1,545% between March 2020 and March 2025) as well as under-the-radar businesses like the once-small-cap company Exlservice (+354% five-year return). Find your next big winner with StockStory today.
