Armstrong World has been treading water for the past six months, holding steady at $154.10.
Is now the time to buy AWI? Or does the price properly account for its business quality and fundamentals? Find out in our full research report, it’s free.
Why Does AWI Stock Spark Debate?
Started as a two-man shop dating back to the 1860s, Armstrong (NYSE: AWI) provides ceiling and wall products to commercial and residential spaces.
Two Positive Attributes:
1. Long-Term Revenue Growth Shows Momentum
A company’s long-term sales performance can indicate its overall quality. Even a bad business can shine for one or two quarters, but a top-tier one grows for years. Luckily, Armstrong World’s sales grew at a decent 7.5% compounded annual growth rate over the last five years. Its growth was slightly above the average industrials company and shows its offerings resonate with customers. 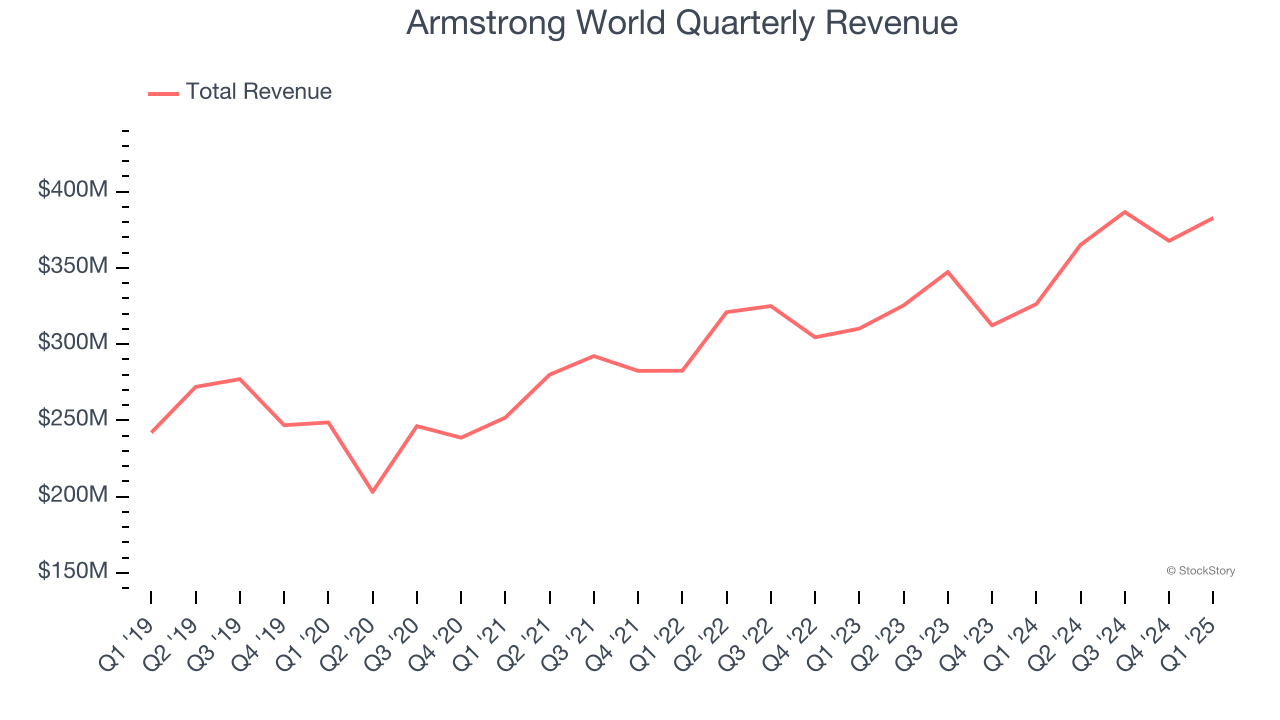
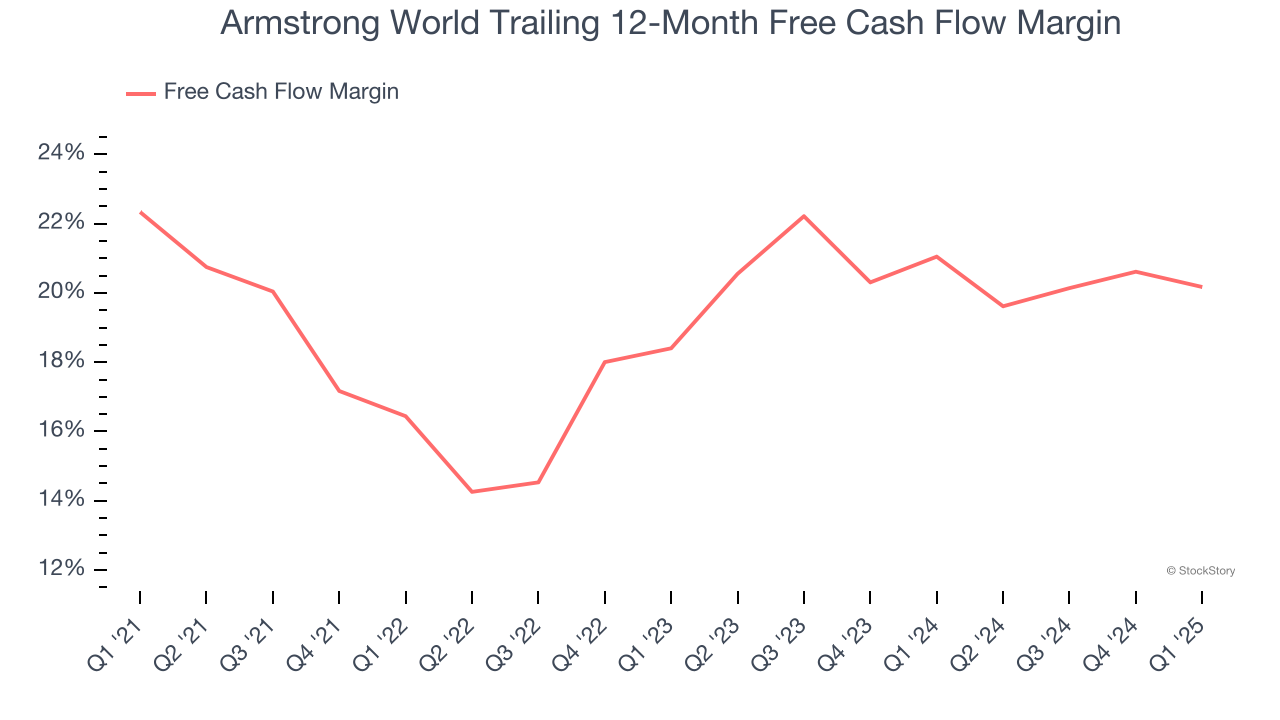
2. Excellent Free Cash Flow Margin Boosts Reinvestment Potential
If you’ve followed StockStory for a while, you know we emphasize free cash flow. Why, you ask? We believe that in the end, cash is king, and you can’t use accounting profits to pay the bills.
Armstrong World has shown terrific cash profitability, putting it in an advantageous position to invest in new products, return capital to investors, and consolidate the market during industry downturns. The company’s free cash flow margin was among the best in the industrials sector, averaging 19.6% over the last five years.
One Reason to be Careful:
Slow Organic Growth Suggests Waning Demand In Core Business
We can better understand Building Materials companies by analyzing their organic revenue. This metric gives visibility into Armstrong World’s core business because it excludes one-time events such as mergers, acquisitions, and divestitures along with foreign currency fluctuations - non-fundamental factors that can manipulate the income statement.
Over the last two years, Armstrong World’s organic revenue averaged 4.1% year-on-year growth. This performance was underwhelming and suggests it may need to improve its products, pricing, or go-to-market strategy, which can add an extra layer of complexity to its operations. 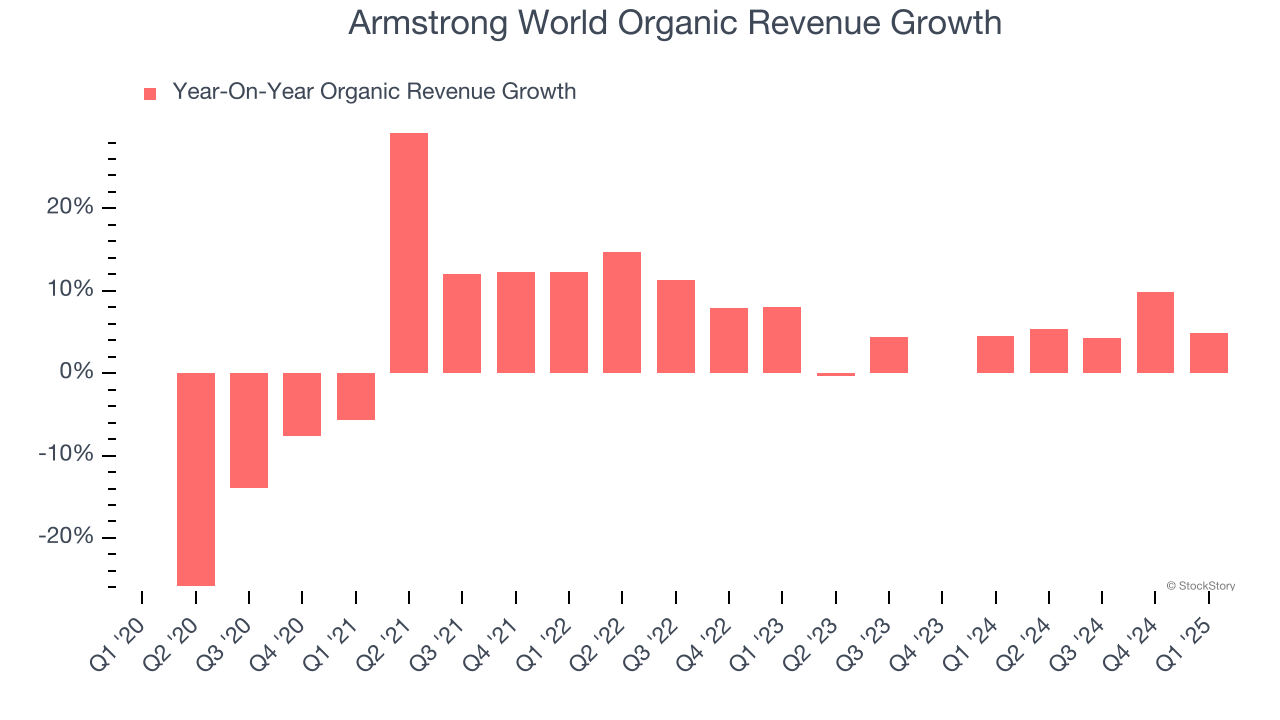
Final Judgment
Armstrong World’s merits more than compensate for its flaws, but at $154.10 per share (or 21.5× forward P/E), is now the right time to buy the stock? See for yourself in our in-depth research report, it’s free.
High-Quality Stocks for All Market Conditions
The market surged in 2024 and reached record highs after Donald Trump’s presidential victory in November, but questions about new economic policies are adding much uncertainty for 2025.
While the crowd speculates what might happen next, we’re homing in on the companies that can succeed regardless of the political or macroeconomic environment. Put yourself in the driver’s seat and build a durable portfolio by checking out our Top 6 Stocks for this week. This is a curated list of our High Quality stocks that have generated a market-beating return of 183% over the last five years (as of March 31st 2025).
Stocks that made our list in 2020 include now familiar names such as Nvidia (+1,545% between March 2020 and March 2025) as well as under-the-radar businesses like the once-small-cap company Comfort Systems (+782% five-year return). Find your next big winner with StockStory today.