Over the past six months, S&T Bancorp’s shares (currently trading at $37.29) have posted a disappointing 12.1% loss while the S&P 500 was flat. This may have investors wondering how to approach the situation.
Is there a buying opportunity in S&T Bancorp, or does it present a risk to your portfolio? See what our analysts have to say in our full research report, it’s free.
Why Is S&T Bancorp Not Exciting?
Even though the stock has become cheaper, we're swiping left on S&T Bancorp for now. Here are three reasons why you should be careful with STBA and a stock we'd rather own.
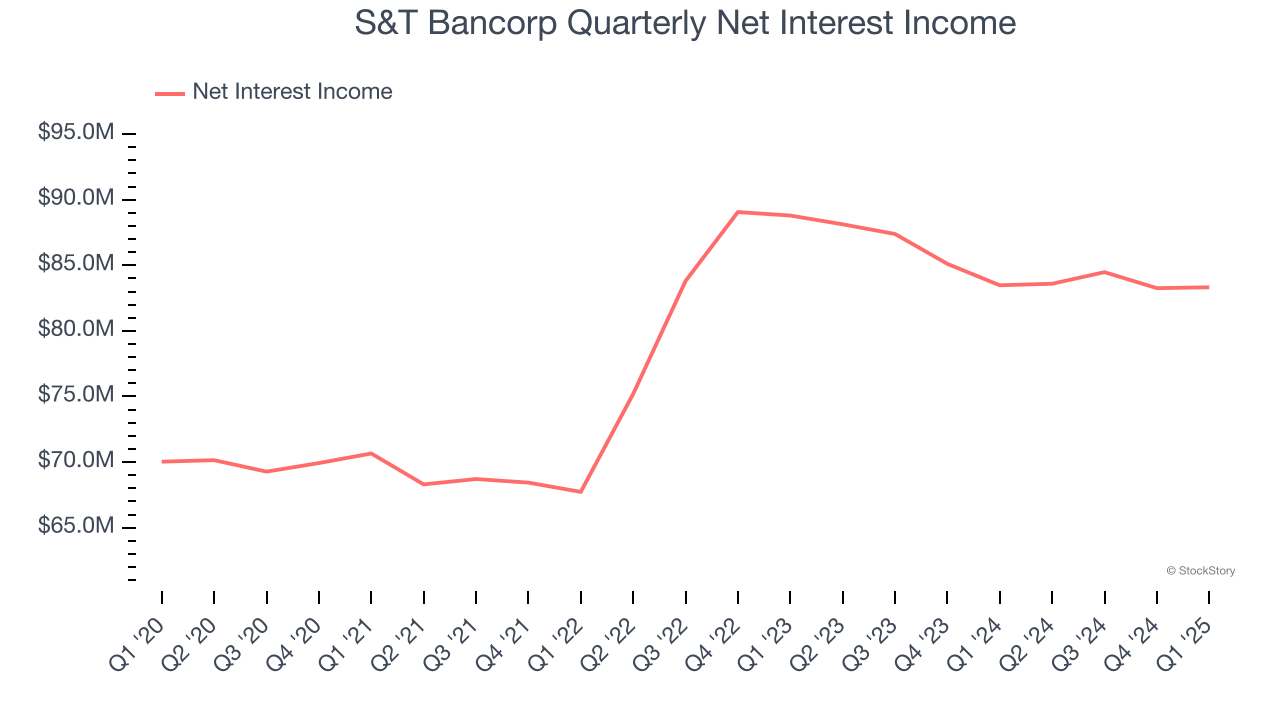
1. Net Interest Income Points to Soft Demand
While banks generate revenue from multiple sources, investors view net interest income as the cornerstone - its predictable, recurring characteristics stand in sharp contrast to the volatility of non-interest income.
S&T Bancorp’s net interest income has grown at a 4.6% annualized rate over the last four years, worse than the broader banking industry.
2. Projected Net Interest Income Growth Is Slim
Forecasted net interest income by Wall Street analysts signals a company’s potential. Predictions may not always be accurate, but accelerating growth typically boosts valuation multiples and stock prices while slowing growth does the opposite.
Over the next 12 months, sell-side analysts expect S&T Bancorp’s net interest income to rise by 3.5%. Although this projection indicates its newer products and services will spur better top-line performance, it is still below the sector average.
3. High Interest Expenses Increase Risk
Leverage is core to the bank's business model (loans funded by deposits) and to ensure their stability, regulators require certain levels of capital and liquidity, focusing on a bank’s Tier 1 capital ratio.
Tier 1 capital is the highest-quality capital that a bank holds, consisting primarily of common stock and retained earnings, but also physical gold. It serves as the primary cushion against losses and is the first line of defense in times of financial distress.
This capital is divided by risk-weighted assets to derive the Tier 1 capital ratio. Risk-weighted means that cash and US treasury securities are assigned little risk while unsecured consumer loans and equity investments get much higher risk weights, for example.
New regulation after the 2008 financial crisis requires that all banks must maintain a Tier 1 capital ratio greater than 4.5% On top of this, there are additional buffers based on scale, risk profile, and other regulatory classifications, so that at the end of the day, banks generally must maintain a 7-10% ratio at minimum.
Over the last two years, S&T Bancorp has averaged a Tier 1 capital ratio of 14.2%, which is considered unsafe in the event of a black swan or if macro or market conditions suddenly deteriorate. For this reason alone, we will be crossing it off our shopping list.
Final Judgment
S&T Bancorp’s business quality ultimately falls short of our standards. After the recent drawdown, the stock trades at 1× forward P/B (or $37.29 per share). At this valuation, there’s a lot of good news priced in - we think there are better opportunities elsewhere. Let us point you toward our favorite semiconductor picks and shovels play.
Stocks We Would Buy Instead of S&T Bancorp
Market indices reached historic highs following Donald Trump’s presidential victory in November 2024, but the outlook for 2025 is clouded by new trade policies that could impact business confidence and growth.
While this has caused many investors to adopt a "fearful" wait-and-see approach, we’re leaning into our best ideas that can grow regardless of the political or macroeconomic climate. Take advantage of Mr. Market by checking out our Top 9 Market-Beating Stocks. This is a curated list of our High Quality stocks that have generated a market-beating return of 183% over the last five years (as of March 31st 2025).
Stocks that made our list in 2020 include now familiar names such as Nvidia (+1,545% between March 2020 and March 2025) as well as under-the-radar businesses like the once-micro-cap company Tecnoglass (+1,754% five-year return). Find your next big winner with StockStory today.