Over the past six months, Papa John's has been a great trade. While the S&P 500 was flat, the stock price has climbed by 19.9% to $50.30 per share. This run-up might have investors contemplating their next move.
Is there a buying opportunity in Papa John's, or does it present a risk to your portfolio? Get the full stock story straight from our expert analysts, it’s free.
Why Do We Think Papa John's Will Underperform?
We’re glad investors have benefited from the price increase, but we're cautious about Papa John's. Here are three reasons why PZZA doesn't excite us and a stock we'd rather own.
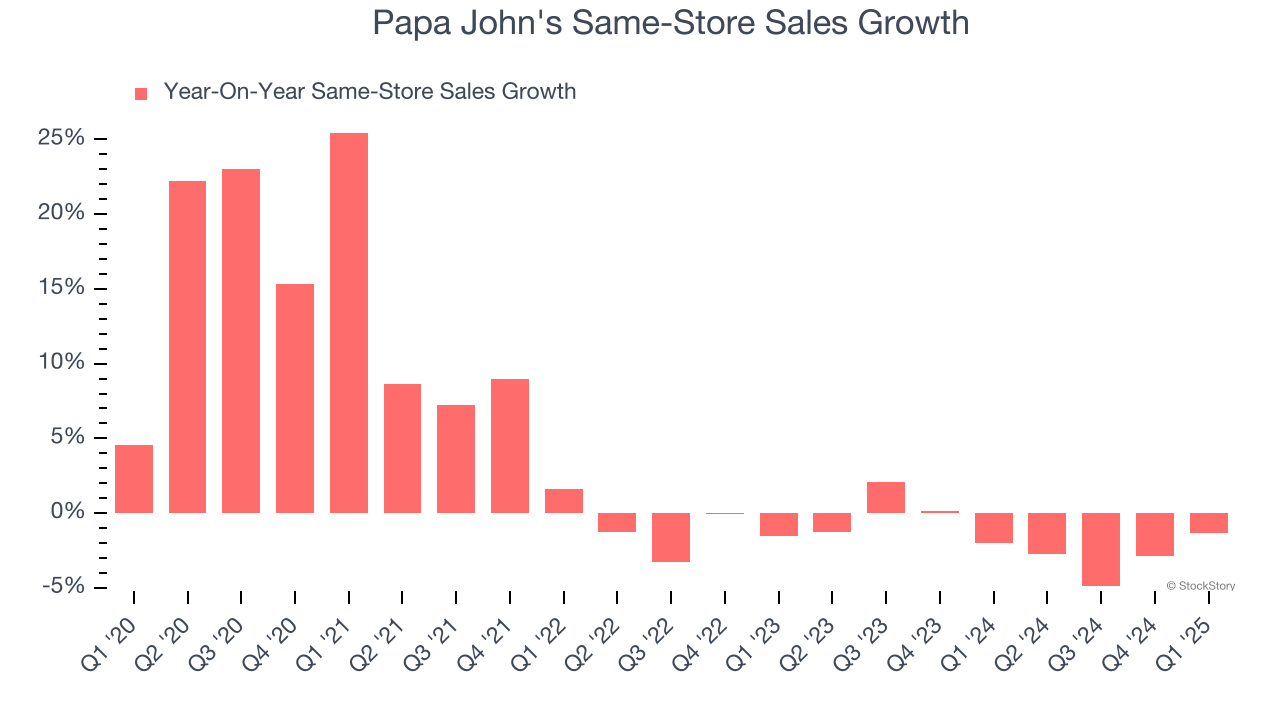
1. Shrinking Same-Store Sales Indicate Waning Demand
Same-store sales is a key performance indicator used to measure organic growth at restaurants open for at least a year.
Papa John’s demand has been shrinking over the last two years as its same-store sales have averaged 1.6% annual declines.
2. Projected Revenue Growth Is Slim
Forecasted revenues by Wall Street analysts signal a company’s potential. Predictions may not always be accurate, but accelerating growth typically boosts valuation multiples and stock prices while slowing growth does the opposite.
Over the next 12 months, sell-side analysts expect Papa John’s revenue to rise by 2.9%, a slight deceleration versus This projection is underwhelming and indicates its menu offerings will see some demand headwinds.
3. Low Gross Margin Reveals Weak Structural Profitability
Gross profit margins tell us how much money a restaurant gets to keep after paying for the direct costs of the meals it sells, like ingredients, and indicate its level of pricing power.
Papa John's has bad unit economics for a restaurant company, signaling it operates in a competitive market and has little room for error if demand unexpectedly falls. As you can see below, it averaged a 17.3% gross margin over the last two years. Said differently, Papa John's had to pay a chunky $82.67 to its suppliers for every $100 in revenue. 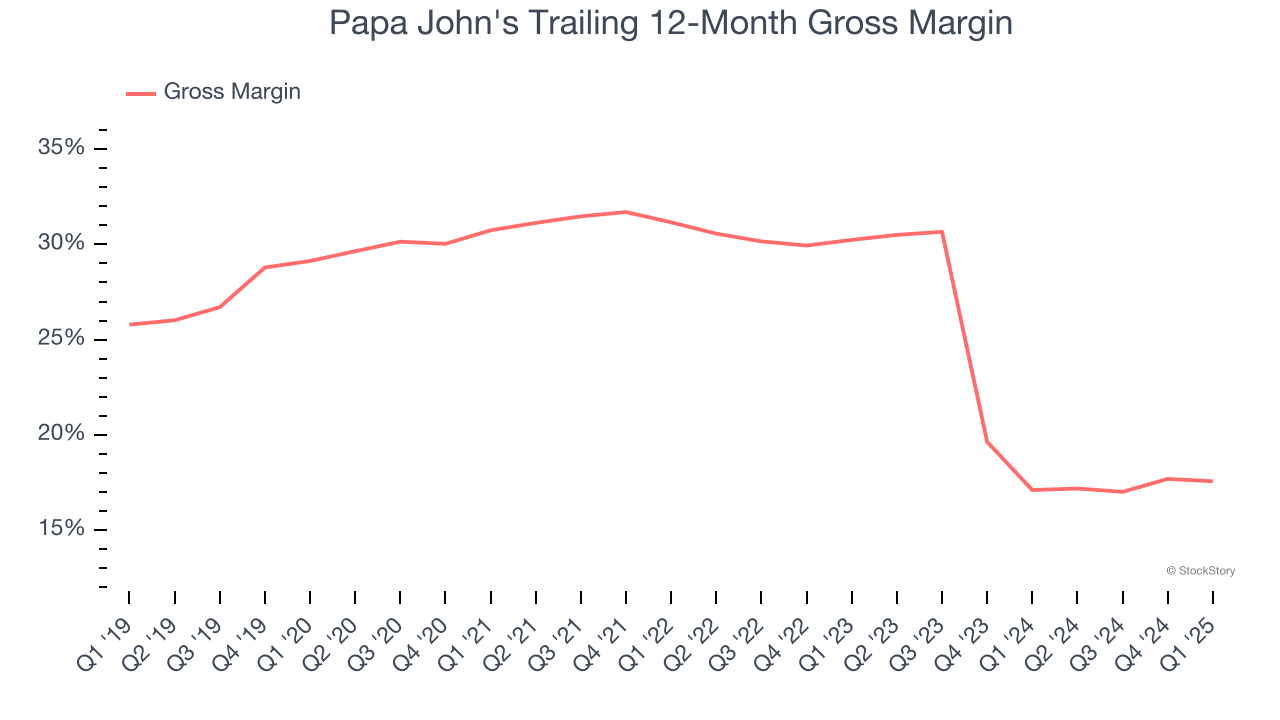
Final Judgment
We cheer for all companies serving everyday consumers, but in the case of Papa John's, we’ll be cheering from the sidelines. With its shares beating the market recently, the stock trades at 24.5× forward P/E (or $50.30 per share). While this valuation is fair, the upside isn’t great compared to the potential downside. There are better investments elsewhere. We’d recommend looking at a fast-growing restaurant franchise with an A+ ranch dressing sauce.
Stocks We Would Buy Instead of Papa John's
The market surged in 2024 and reached record highs after Donald Trump’s presidential victory in November, but questions about new economic policies are adding much uncertainty for 2025.
While the crowd speculates what might happen next, we’re homing in on the companies that can succeed regardless of the political or macroeconomic environment. Put yourself in the driver’s seat and build a durable portfolio by checking out our Top 9 Market-Beating Stocks. This is a curated list of our High Quality stocks that have generated a market-beating return of 183% over the last five years (as of March 31st 2025).
Stocks that made our list in 2020 include now familiar names such as Nvidia (+1,545% between March 2020 and March 2025) as well as under-the-radar businesses like the once-small-cap company Comfort Systems (+782% five-year return). Find your next big winner with StockStory today.