Over the past six months, Bright Horizons has been a great trade. While the S&P 500 was flat, the stock price has climbed by 14.2% to $123.46 per share. This was partly due to its solid quarterly results, and the run-up might have investors contemplating their next move.
Is now the time to buy Bright Horizons, or should you be careful about including it in your portfolio? Dive into our full research report to see our analyst team’s opinion, it’s free.
Why Do We Think Bright Horizons Will Underperform?
Despite the momentum, we don't have much confidence in Bright Horizons. Here are three reasons why there are better opportunities than BFAM and a stock we'd rather own.
1. Slow Organic Growth Suggests Waning Demand In Core Business
In addition to reported revenue, organic revenue is a useful data point for analyzing Education Services companies. This metric gives visibility into Bright Horizons’s core business because it excludes one-time events such as mergers, acquisitions, and divestitures along with foreign currency fluctuations - non-fundamental factors that can manipulate the income statement.
Over the last two years, Bright Horizons’s organic revenue averaged 12.6% year-on-year growth. This performance slightly lagged the sector and suggests it may need to improve its products, pricing, or go-to-market strategy, which can add an extra layer of complexity to its operations. 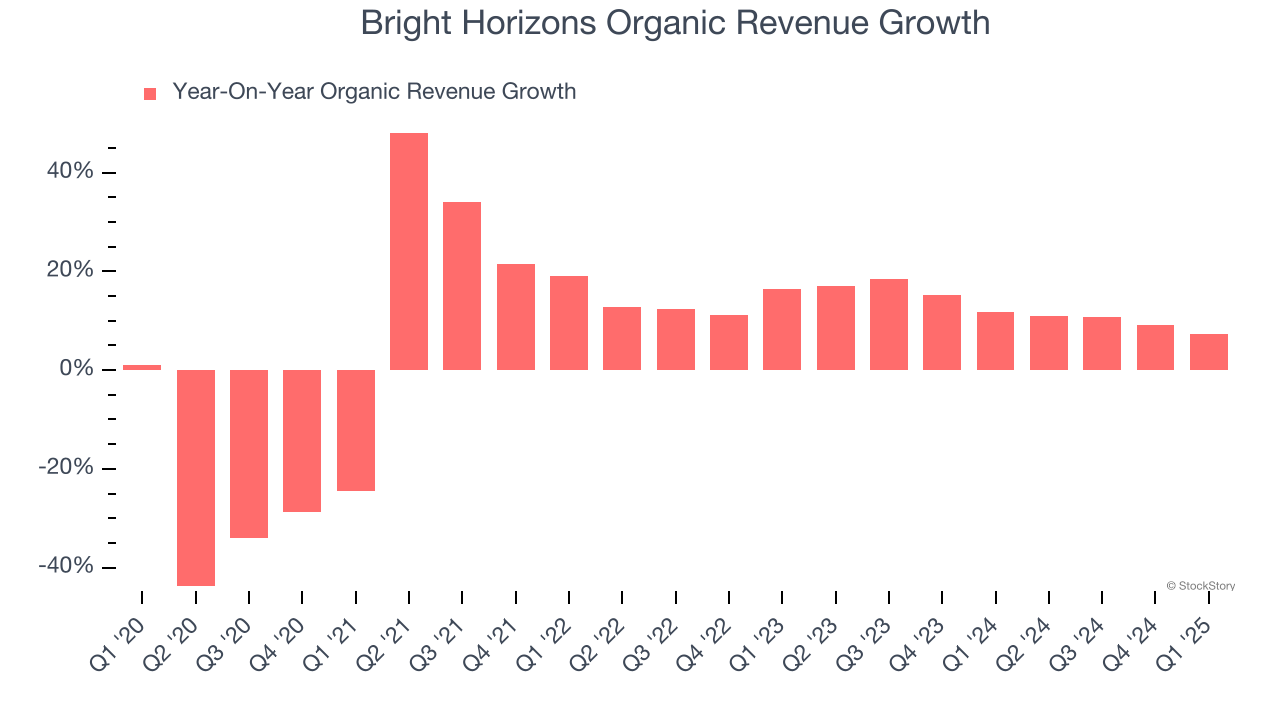
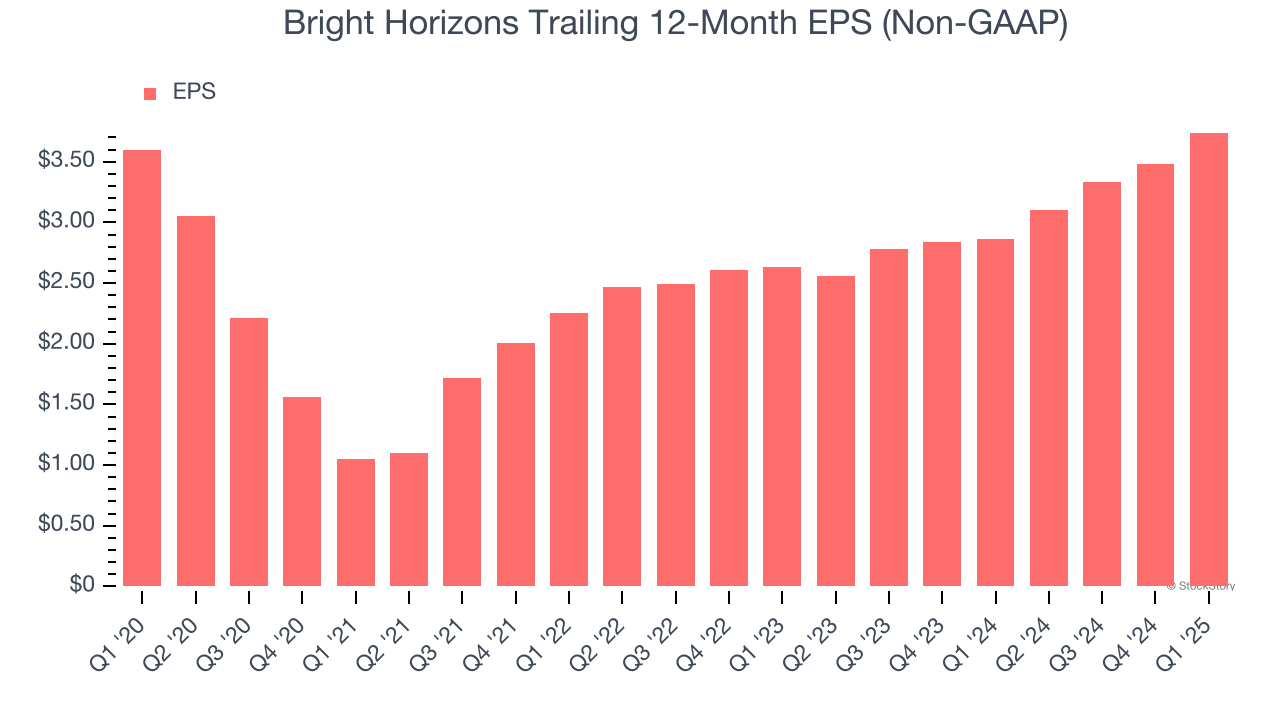
2. EPS Growth Has Stalled
We track the long-term change in earnings per share (EPS) because it highlights whether a company’s growth is profitable.
Bright Horizons’s flat EPS over the last five years was below its 5.7% annualized revenue growth. This tells us the company became less profitable on a per-share basis as it expanded.
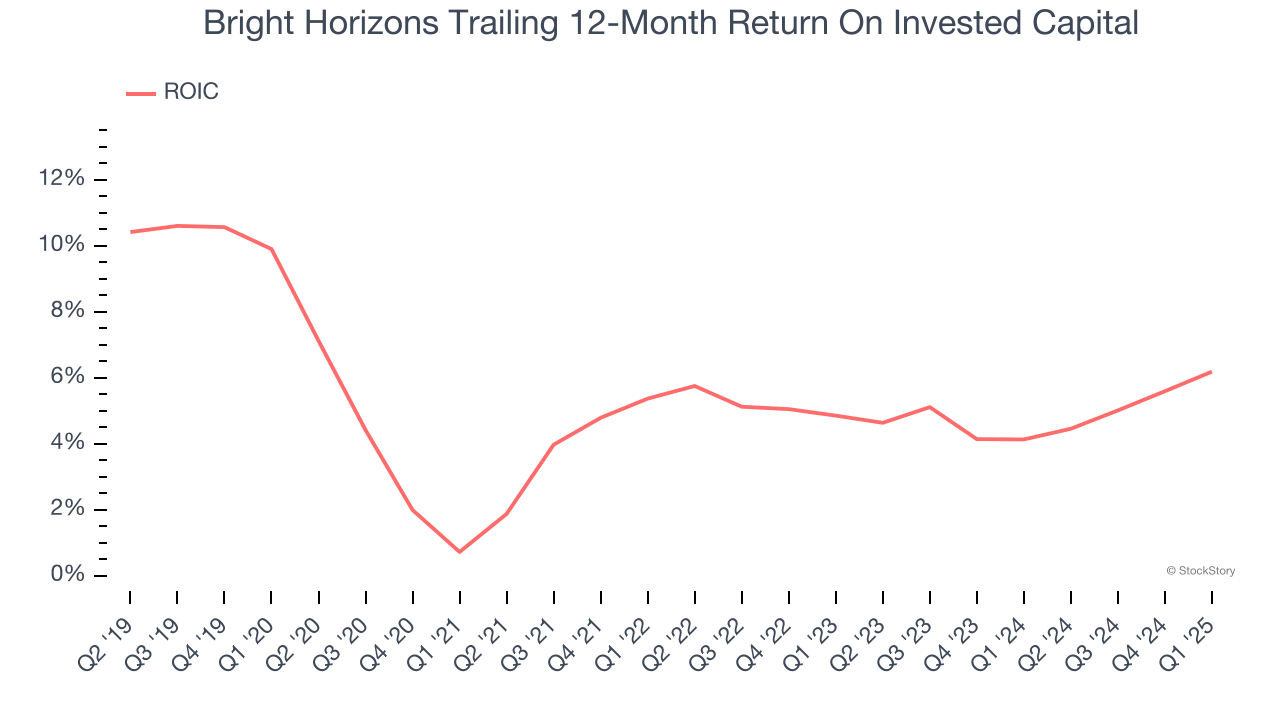
3. Previous Growth Initiatives Haven’t Impressed
Growth gives us insight into a company’s long-term potential, but how capital-efficient was that growth? A company’s ROIC explains this by showing how much operating profit it makes compared to the money it has raised (debt and equity).
Bright Horizons historically did a mediocre job investing in profitable growth initiatives. Its five-year average ROIC was 4.3%, lower than the typical cost of capital (how much it costs to raise money) for consumer discretionary companies.
Final Judgment
Bright Horizons falls short of our quality standards. With its shares beating the market recently, the stock trades at 29.7× forward P/E (or $123.46 per share). This valuation tells us a lot of optimism is priced in - we think there are better stocks to buy right now. We’d suggest looking at the most dominant software business in the world.
Stocks We Like More Than Bright Horizons
Donald Trump’s victory in the 2024 U.S. Presidential Election sent major indices to all-time highs, but stocks have retraced as investors debate the health of the economy and the potential impact of tariffs.
While this leaves much uncertainty around 2025, a few companies are poised for long-term gains regardless of the political or macroeconomic climate, like our Top 9 Market-Beating Stocks. This is a curated list of our High Quality stocks that have generated a market-beating return of 183% over the last five years (as of March 31st 2025).
Stocks that made our list in 2020 include now familiar names such as Nvidia (+1,545% between March 2020 and March 2025) as well as under-the-radar businesses like the once-small-cap company Comfort Systems (+782% five-year return). Find your next big winner with StockStory today.