
Dillard's has generally followed the market’s trajectory. The stock is down 5.2% to $414.14 per share over the past six months while the S&P 500 is flat. This may have investors wondering how to approach the situation.
Is there a buying opportunity in Dillard's, or does it present a risk to your portfolio? Get the full stock story straight from our expert analysts, it’s free.
Why Is Dillard's Not Exciting?
Even though the stock has become cheaper, we don't have much confidence in Dillard's. Here are three reasons why we avoid DDS and a stock we'd rather own.
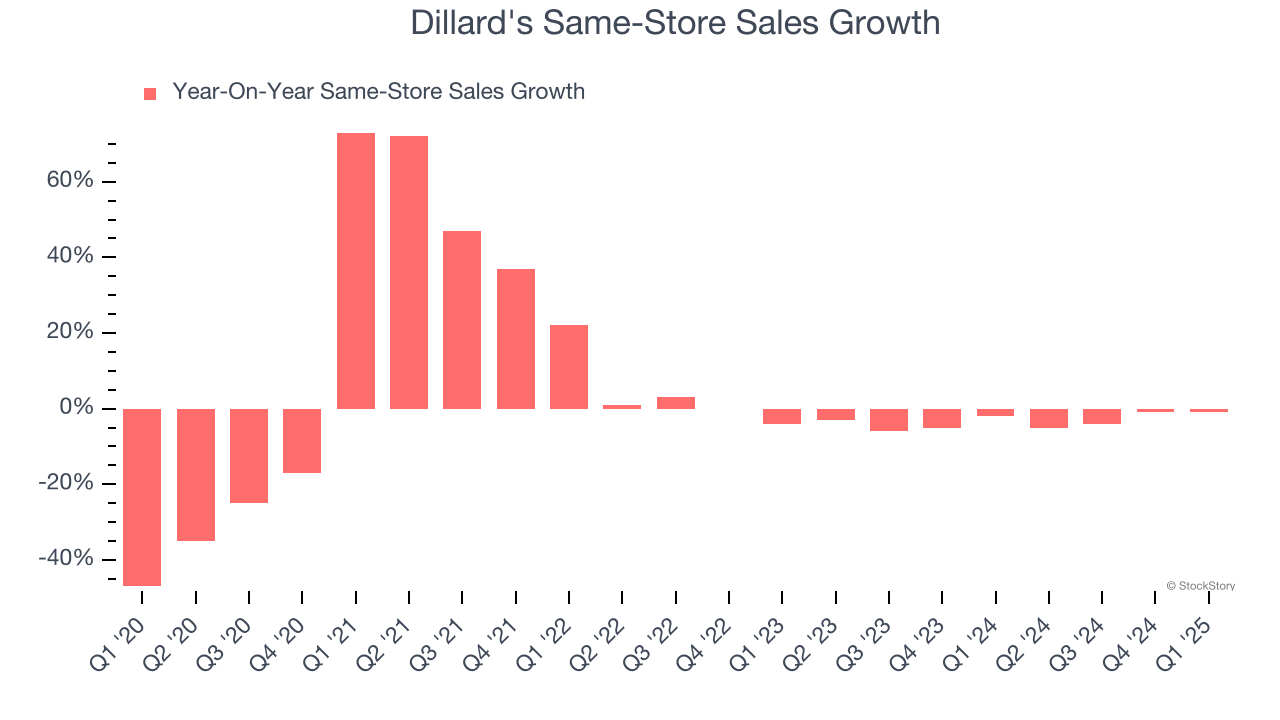
1. Shrinking Same-Store Sales Indicate Waning Demand
Same-store sales is an industry measure of whether revenue is growing at existing stores, and it is driven by customer visits (often called traffic) and the average spending per customer (ticket).
Dillard’s demand has been shrinking over the last two years as its same-store sales have averaged 3.4% annual declines.
2. Revenue Projections Show Stormy Skies Ahead
Forecasted revenues by Wall Street analysts signal a company’s potential. Predictions may not always be accurate, but accelerating growth typically boosts valuation multiples and stock prices while slowing growth does the opposite.
Over the next 12 months, sell-side analysts expect Dillard’s revenue to drop by 2.1%, a decrease from This projection is underwhelming and implies its products will face some demand challenges.
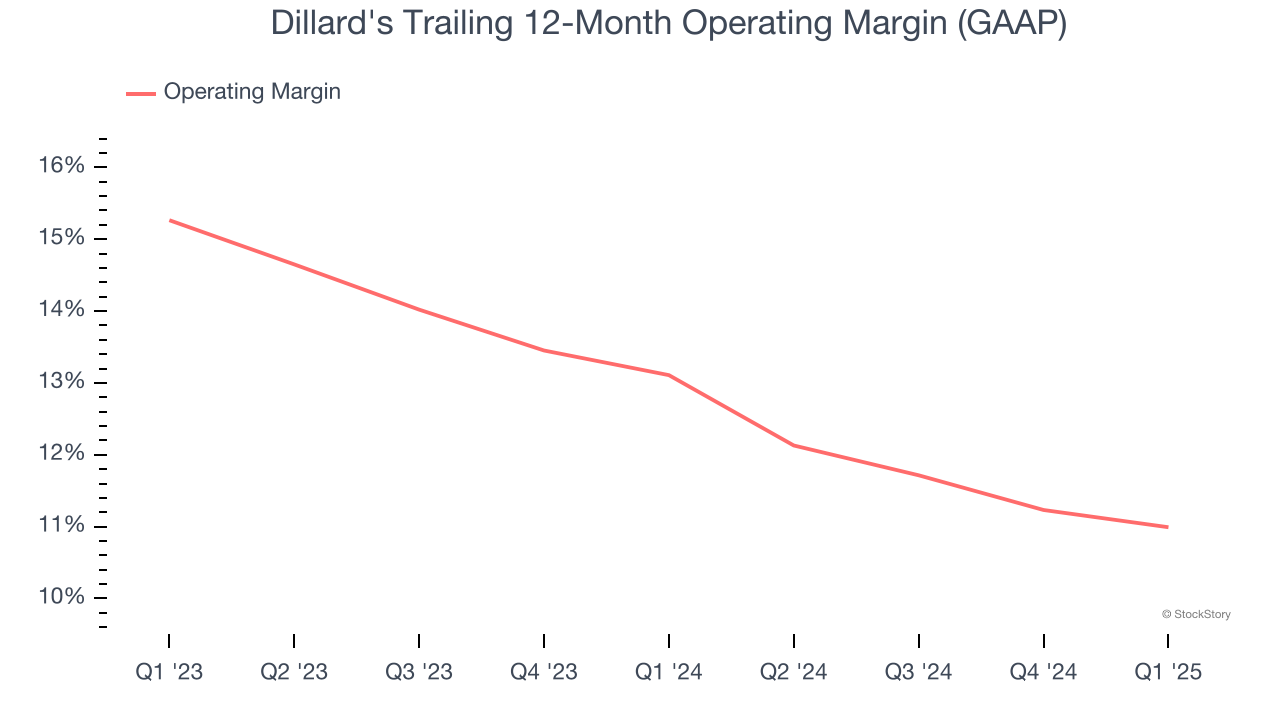
3. Shrinking Operating Margin
Operating margin is an important measure of profitability for retailers as it accounts for all expenses necessary to run a store, including wages, inventory, rent, advertising, and other administrative costs.
Looking at the trend in its profitability, Dillard’s operating margin decreased by 2.1 percentage points over the last year. Even though its historical margin was healthy, shareholders will want to see Dillard's become more profitable in the future. Its operating margin for the trailing 12 months was 11%.
Final Judgment
Dillard’s business quality ultimately falls short of our standards. After the recent drawdown, the stock trades at 9.9× forward EV-to-EBITDA (or $414.14 per share). At this valuation, there’s a lot of good news priced in - you can find better investment opportunities elsewhere. We’d suggest looking at the most dominant software business in the world.
Stocks We Like More Than Dillard's
Donald Trump’s victory in the 2024 U.S. Presidential Election sent major indices to all-time highs, but stocks have retraced as investors debate the health of the economy and the potential impact of tariffs.
While this leaves much uncertainty around 2025, a few companies are poised for long-term gains regardless of the political or macroeconomic climate, like our Top 9 Market-Beating Stocks. This is a curated list of our High Quality stocks that have generated a market-beating return of 183% over the last five years (as of March 31st 2025).
Stocks that made our list in 2020 include now familiar names such as Nvidia (+1,545% between March 2020 and March 2025) as well as under-the-radar businesses like the once-micro-cap company Kadant (+351% five-year return). Find your next big winner with StockStory today.