
Over the past six months, Hexcel’s stock price fell to $54.45. Shareholders have lost 14.4% of their capital, disappointing when considering the S&P 500 was flat. This was partly due to its softer quarterly results and may have investors wondering how to approach the situation.
Is there a buying opportunity in Hexcel, or does it present a risk to your portfolio? See what our analysts have to say in our full research report, it’s free.
Why Is Hexcel Not Exciting?
Despite the more favorable entry price, we're cautious about Hexcel. Here are three reasons why HXL doesn't excite us and a stock we'd rather own.
1. Revenue Spiraling Downwards
A company’s long-term sales performance can indicate its overall quality. Any business can experience short-term success, but top-performing ones enjoy sustained growth for years. Hexcel’s demand was weak over the last five years as its sales fell at a 3.8% annual rate. This wasn’t a great result and signals it’s a lower quality business. 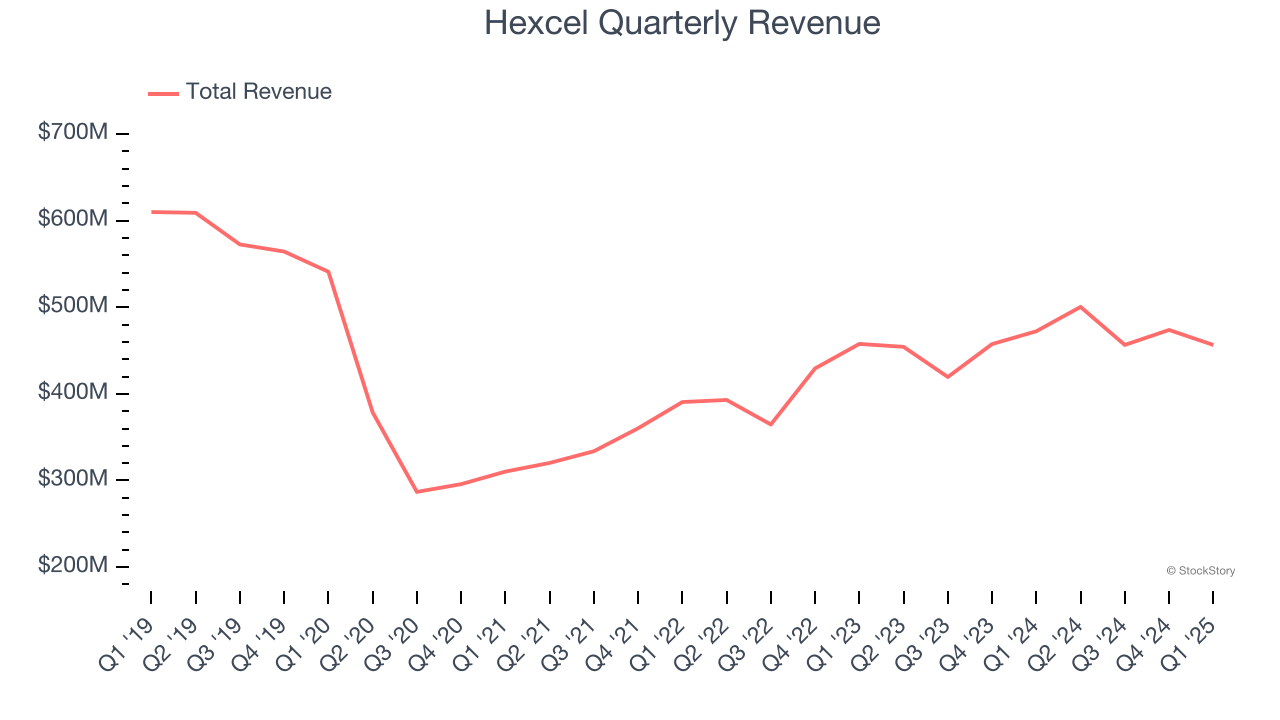
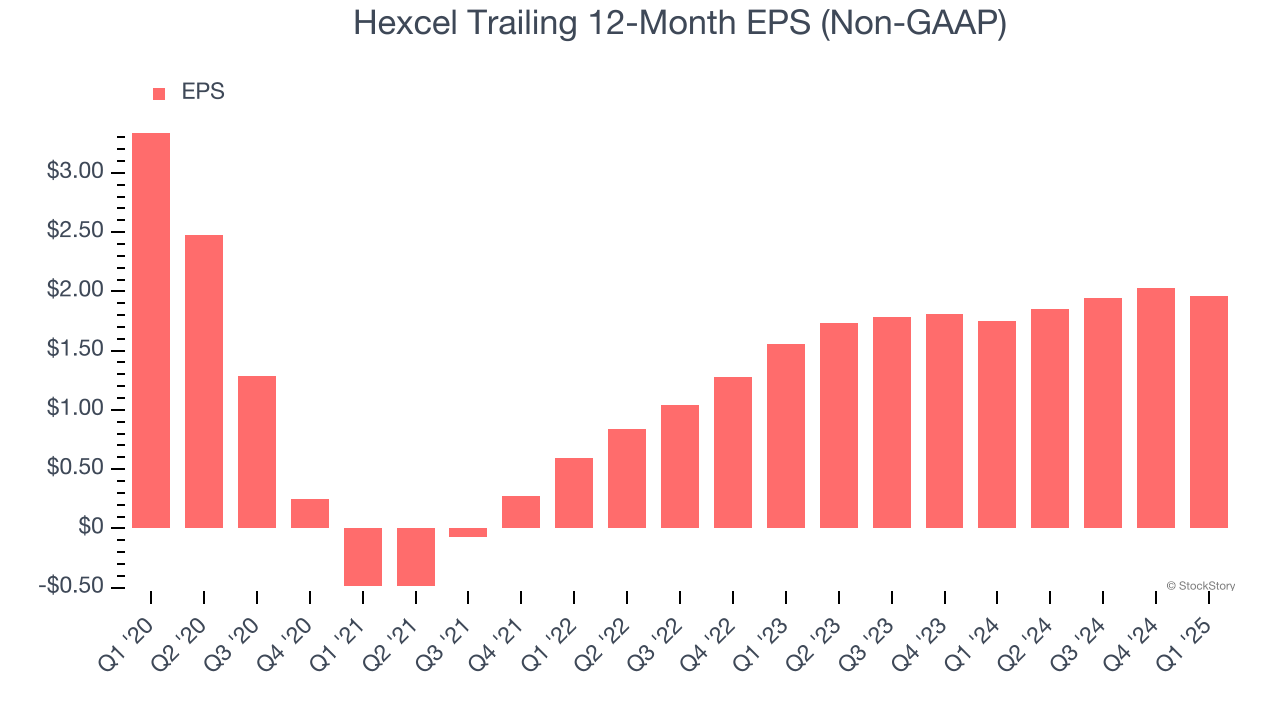
2. EPS Trending Down
We track the long-term change in earnings per share (EPS) because it highlights whether a company’s growth is profitable.
Sadly for Hexcel, its EPS declined by 10.1% annually over the last five years, more than its revenue. This tells us the company struggled because its fixed cost base made it difficult to adjust to shrinking demand.
3. Free Cash Flow Margin Dropping
If you’ve followed StockStory for a while, you know we emphasize free cash flow. Why, you ask? We believe that in the end, cash is king, and you can’t use accounting profits to pay the bills.
As you can see below, Hexcel’s margin dropped by 8 percentage points over the last five years. If its declines continue, it could signal increasing investment needs and capital intensity. Hexcel’s free cash flow margin for the trailing 12 months was 9.7%.

Final Judgment
Hexcel’s business quality ultimately falls short of our standards. After the recent drawdown, the stock trades at 24× forward P/E (or $54.45 per share). This multiple tells us a lot of good news is priced in - we think there are better opportunities elsewhere. We’d recommend looking at the most entrenched endpoint security platform on the market.
Stocks We Would Buy Instead of Hexcel
Donald Trump’s victory in the 2024 U.S. Presidential Election sent major indices to all-time highs, but stocks have retraced as investors debate the health of the economy and the potential impact of tariffs.
While this leaves much uncertainty around 2025, a few companies are poised for long-term gains regardless of the political or macroeconomic climate, like our Top 5 Strong Momentum Stocks for this week. This is a curated list of our High Quality stocks that have generated a market-beating return of 183% over the last five years (as of March 31st 2025).
Stocks that made our list in 2020 include now familiar names such as Nvidia (+1,545% between March 2020 and March 2025) as well as under-the-radar businesses like the once-small-cap company Exlservice (+354% five-year return). Find your next big winner with StockStory today.
