Over the past six months, IMAX has been a great trade. While the S&P 500 was flat, the stock price has climbed by 15.6% to $29.24 per share. This was partly due to its solid quarterly results, and the run-up might have investors contemplating their next move.
Is now the time to buy IMAX, or should you be careful about including it in your portfolio? Check out our in-depth research report to see what our analysts have to say, it’s free.
Why Is IMAX Not Exciting?
We’re glad investors have benefited from the price increase, but we're sitting this one out for now. Here are three reasons why we avoid IMAX and a stock we'd rather own.
1. Long-Term Revenue Growth Flatter Than a Pancake
A company’s long-term sales performance is one signal of its overall quality. Any business can have short-term success, but a top-tier one grows for years. Unfortunately, IMAX struggled to consistently increase demand as its $359.8 million of sales for the trailing 12 months was close to its revenue five years ago. This was below our standards and signals it’s a lower quality business. 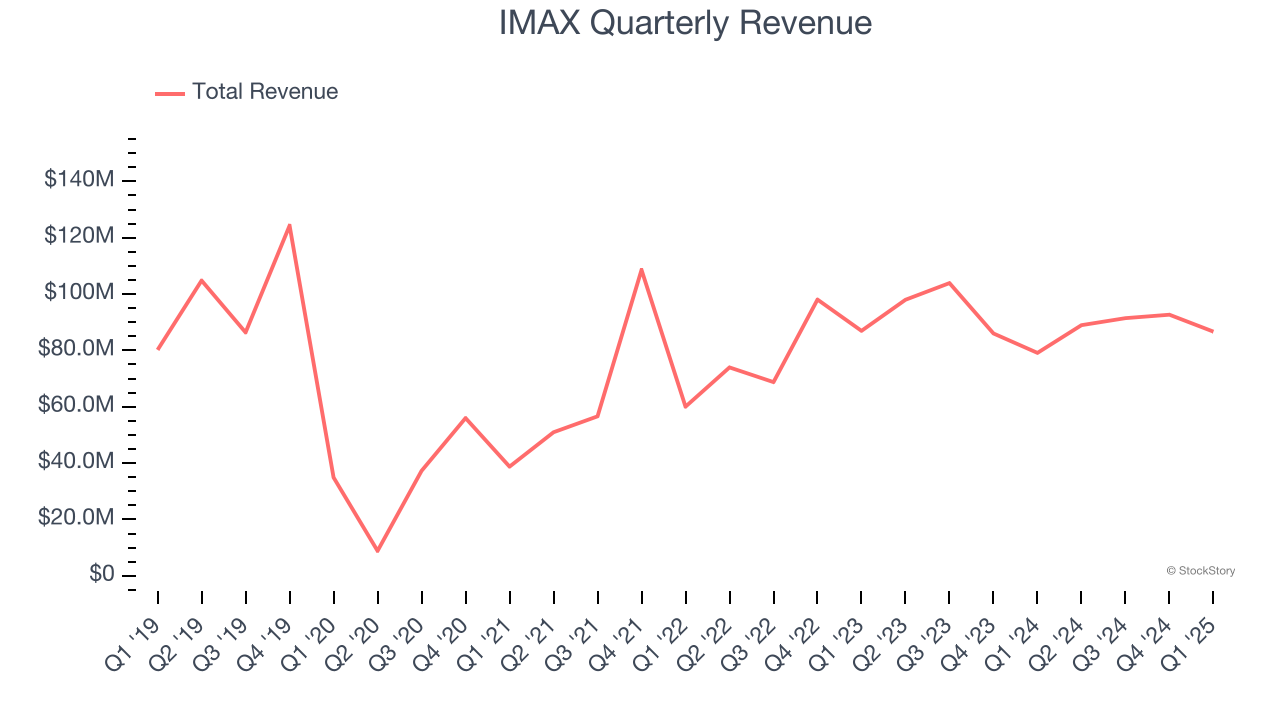
2. Cash Burn Ignites Concerns
Free cash flow isn't a prominently featured metric in company financials and earnings releases, but we think it's telling because it accounts for all operating and capital expenses, making it tough to manipulate. Cash is king.
IMAX’s demanding reinvestments have drained its resources over the last five years, putting it in a pinch and limiting its ability to return capital to investors. Its free cash flow margin averaged negative 1.3%, meaning it lit $1.34 of cash on fire for every $100 in revenue.

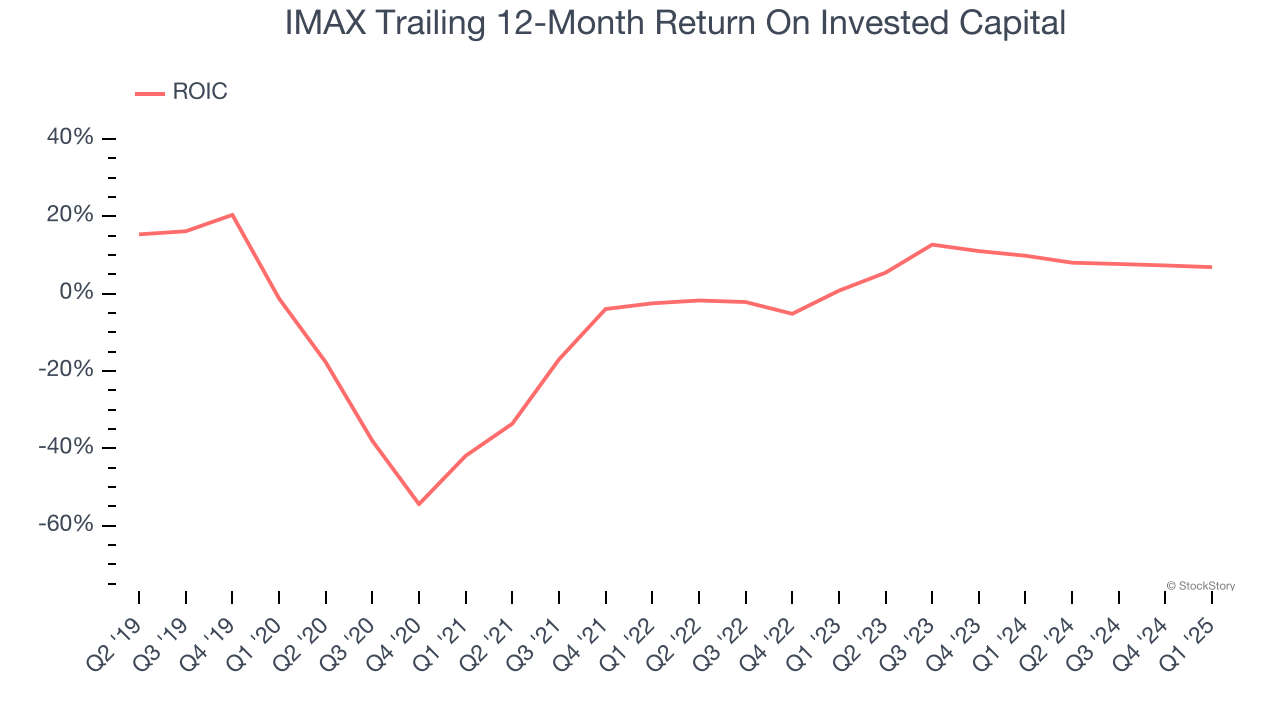
3. Previous Growth Initiatives Have Lost Money
Growth gives us insight into a company’s long-term potential, but how capital-efficient was that growth? A company’s ROIC explains this by showing how much operating profit it makes compared to the money it has raised (debt and equity).
IMAX’s five-year average ROIC was negative 5.4%, meaning management lost money while trying to expand the business. Its returns were among the worst in the business services sector.
Final Judgment
IMAX’s business quality ultimately falls short of our standards. With its shares topping the market in recent months, the stock trades at 23.4× forward P/E (or $29.24 per share). Beauty is in the eye of the beholder, but our analysis shows the upside isn’t great compared to the potential downside. We're fairly confident there are better stocks to buy right now. We’d recommend looking at one of Charlie Munger’s all-time favorite businesses.
High-Quality Stocks for All Market Conditions
Market indices reached historic highs following Donald Trump’s presidential victory in November 2024, but the outlook for 2025 is clouded by new trade policies that could impact business confidence and growth.
While this has caused many investors to adopt a "fearful" wait-and-see approach, we’re leaning into our best ideas that can grow regardless of the political or macroeconomic climate. Take advantage of Mr. Market by checking out our Top 5 Strong Momentum Stocks for this week. This is a curated list of our High Quality stocks that have generated a market-beating return of 183% over the last five years (as of March 31st 2025).
Stocks that made our list in 2020 include now familiar names such as Nvidia (+1,545% between March 2020 and March 2025) as well as under-the-radar businesses like the once-micro-cap company Kadant (+351% five-year return). Find your next big winner with StockStory today.