
As the Q1 earnings season wraps, let’s dig into this quarter’s best and worst performers in the semiconductor manufacturing industry, including Amkor (NASDAQ: AMKR) and its peers.
The semiconductor industry is driven by demand for advanced electronic products like smartphones, PCs, servers, and data storage. The need for technologies like artificial intelligence, 5G networks, and smart cars is also creating the next wave of growth for the industry. Keeping up with this dynamism requires new tools that can design, fabricate, and test chips at ever smaller sizes and more complex architectures, creating a dire need for semiconductor capital manufacturing equipment.
The 14 semiconductor manufacturing stocks we track reported a mixed Q1. As a group, revenues missed analysts’ consensus estimates by 0.7% while next quarter’s revenue guidance was 2.9% below.
Luckily, semiconductor manufacturing stocks have performed well with share prices up 13.2% on average since the latest earnings results.
Amkor (NASDAQ: AMKR)
Operating through a largely Asian facility footprint, Amkor Technologies (NASDAQ: AMKR) provides outsourced packaging and testing for semiconductors.
Amkor reported revenues of $1.32 billion, down 3.2% year on year. This print exceeded analysts’ expectations by 3%. Overall, it was a strong quarter for the company with a solid beat of analysts’ adjusted operating income estimates and an impressive beat of analysts’ EPS estimates.
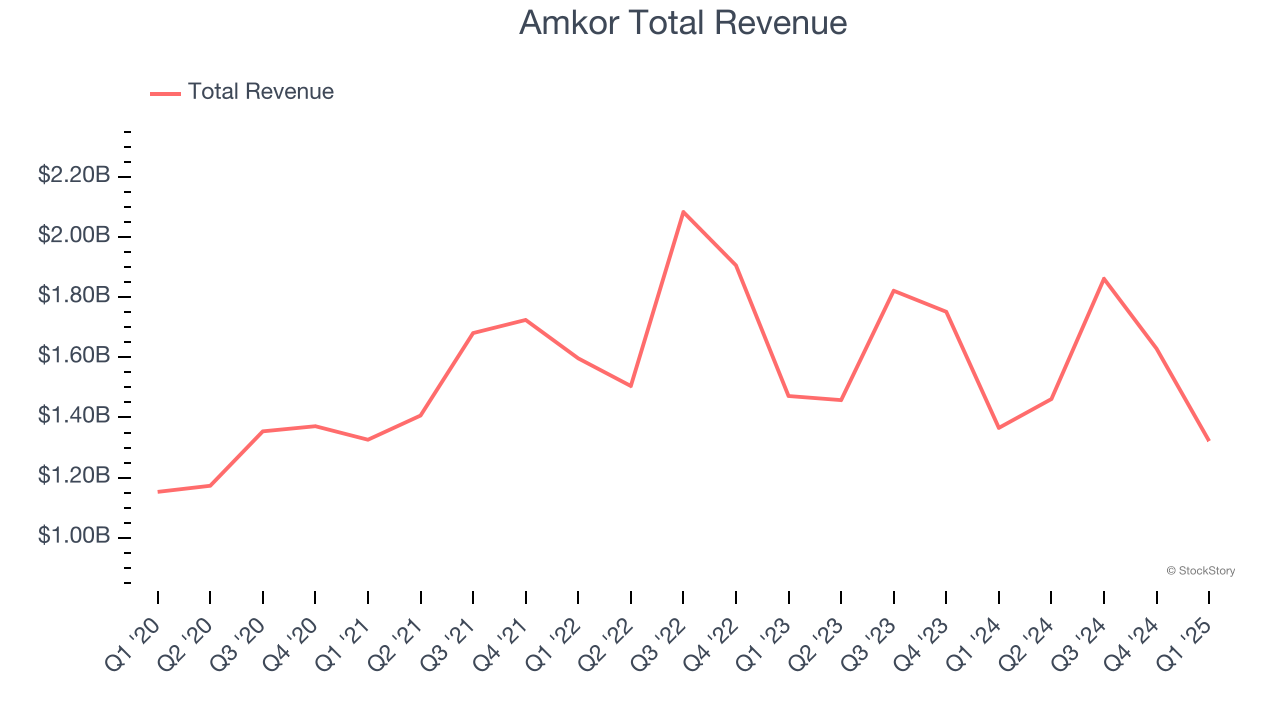
Amkor scored the biggest analyst estimates beat of the whole group. The stock is up 17% since reporting and currently trades at $20.45.
Is now the time to buy Amkor? Access our full analysis of the earnings results here, it’s free.
Best Q1: FormFactor (NASDAQ: FORM)
With customers across the foundry and fabless markets, FormFactor (NASDAQ: FORM) is a US-based provider of test and measurement technologies for semiconductors.
FormFactor reported revenues of $171.4 million, up 1.6% year on year, outperforming analysts’ expectations by 0.9%. The business had a strong quarter with an impressive beat of analysts’ EPS estimates and a solid beat of analysts’ adjusted operating income estimates.
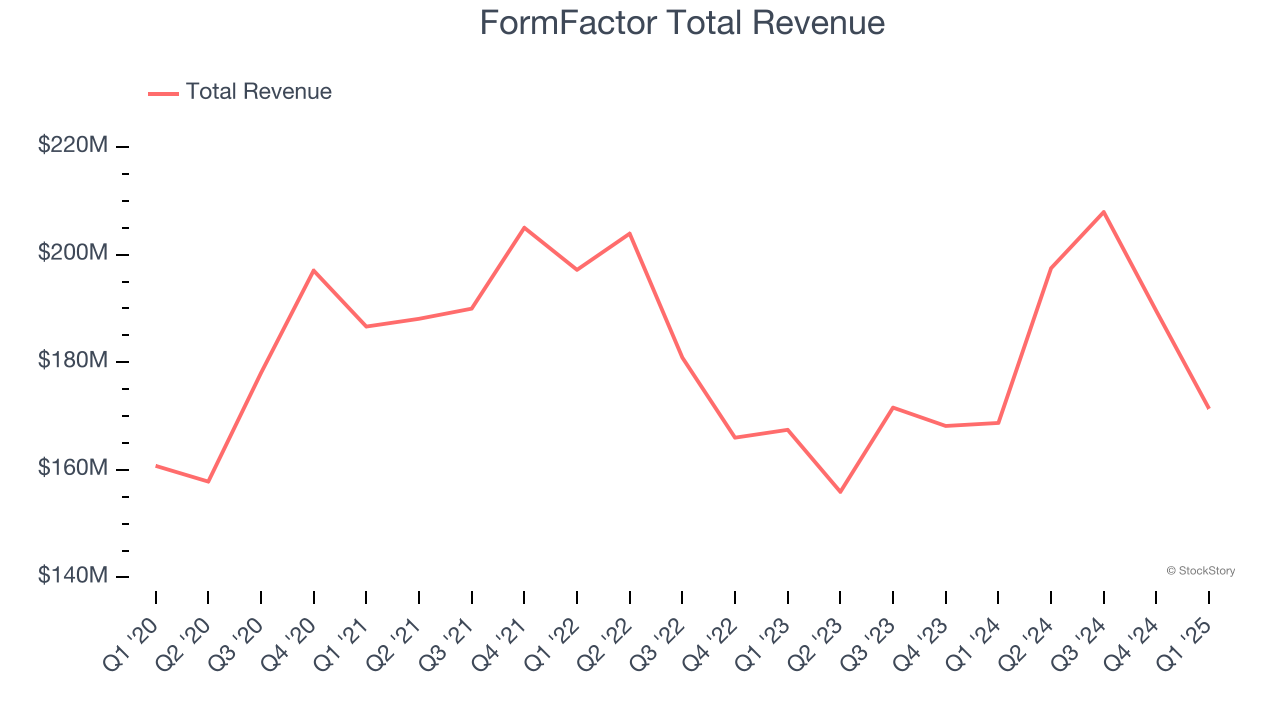
The market seems happy with the results as the stock is up 24.2% since reporting. It currently trades at $34.87.
Is now the time to buy FormFactor? Access our full analysis of the earnings results here, it’s free.
Weakest Q1: Photronics (NASDAQ: PLAB)
Sporting a global footprint of facilities, Photronics (NASDAQ: PLAB) is a manufacturer of photomasks, templates used to transfer patterns onto semiconductor wafers.
Photronics reported revenues of $211 million, down 2.8% year on year, in line with analysts’ expectations. It was a disappointing quarter as it posted revenue guidance for next quarter missing analysts’ expectations and a significant miss of analysts’ EPS estimates.
As expected, the stock is down 5.6% since the results and currently trades at $18.95.
Read our full analysis of Photronics’s results here.
Applied Materials (NASDAQ: AMAT)
Founded in 1967 as the first company to develop tools for other businesses in the semiconductor industry, Applied Materials (NASDAQ: AMAT) is the largest provider of semiconductor wafer fabrication equipment.
Applied Materials reported revenues of $7.1 billion, up 6.8% year on year. This print was in line with analysts’ expectations. Zooming out, it was a mixed quarter as it also recorded a solid beat of analysts’ EPS estimates but an increase in its inventory levels.
The stock is flat since reporting and currently trades at $175.48.
Read our full, actionable report on Applied Materials here, it’s free.
Nova (NASDAQ: NVMI)
Headquartered in Israel, Nova (NASDAQ: NVMI) is a provider of quality control systems used in semiconductor manufacturing.
Nova reported revenues of $213.4 million, up 50.5% year on year. This result topped analysts’ expectations by 1.2%. It was a strong quarter as it also recorded a solid beat of analysts’ adjusted operating income estimates and an impressive beat of analysts’ EPS estimates.
The stock is up 14.1% since reporting and currently trades at $230.
Read our full, actionable report on Nova here, it’s free.
Market Update
The Fed’s interest rate hikes throughout 2022 and 2023 have successfully cooled post-pandemic inflation, bringing it closer to the 2% target. Inflationary pressures have eased without tipping the economy into a recession, suggesting a soft landing. This stability, paired with recent rate cuts (0.5% in September 2024 and 0.25% in November 2024), fueled a strong year for the stock market in 2024. The markets surged further after Donald Trump’s presidential victory in November, with major indices reaching record highs in the days following the election. Still, questions remain about the direction of economic policy, as potential tariffs and corporate tax changes add uncertainty for 2025.
Want to invest in winners with rock-solid fundamentals? Check out our 9 Best Market-Beating Stocks and add them to your watchlist. These companies are poised for growth regardless of the political or macroeconomic climate.