
Over the last six months, CVB Financial’s shares have sunk to $18.15, producing a disappointing 15.1% loss - a stark contrast to the S&P 500’s 1.7% gain. This may have investors wondering how to approach the situation.
Is now the time to buy CVB Financial, or should you be careful about including it in your portfolio? Get the full stock story straight from our expert analysts, it’s free.
Why Do We Think CVB Financial Will Underperform?
Despite the more favorable entry price, we're swiping left on CVB Financial for now. Here are three reasons why there are better opportunities than CVBF and a stock we'd rather own.
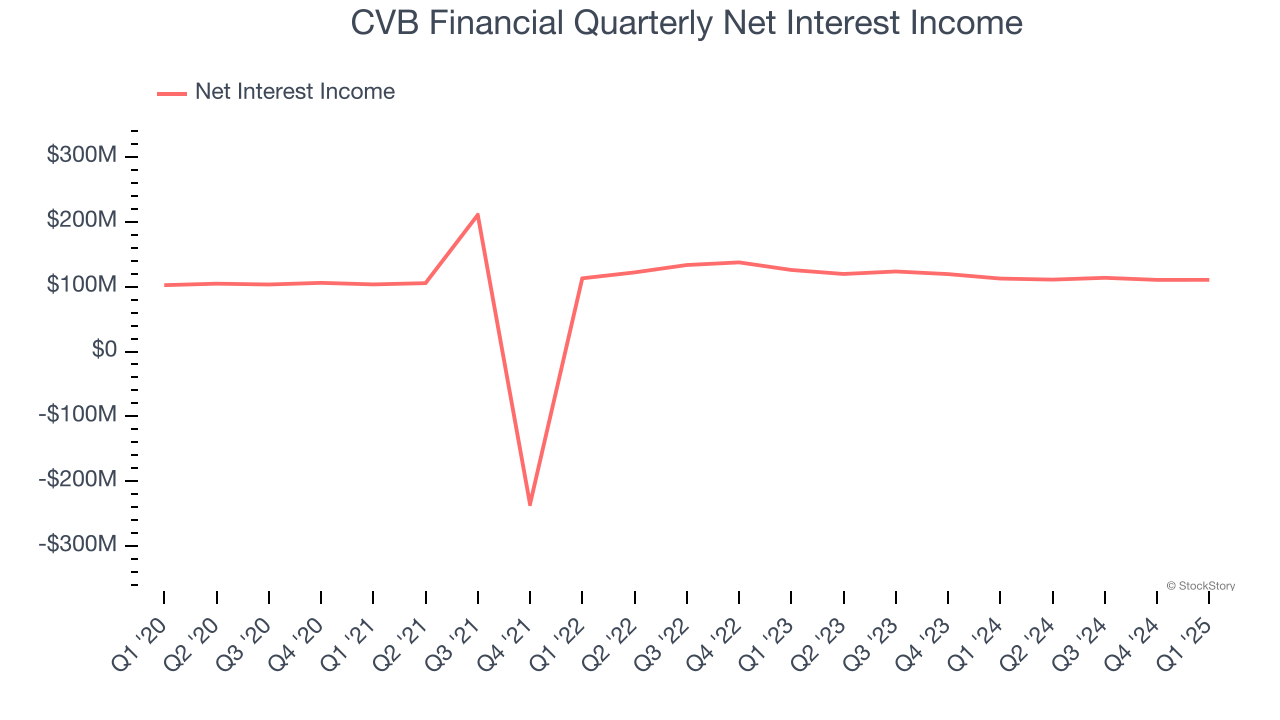
1. Net Interest Income Points to Soft Demand
Markets consistently prioritize net interest income growth over fee-based revenue, recognizing its superior quality and recurring nature compared to the more unpredictable non-interest income streams.
CVB Financial’s net interest income has grown at a 1.6% annualized rate over the last four years, much worse than the broader bank industry.
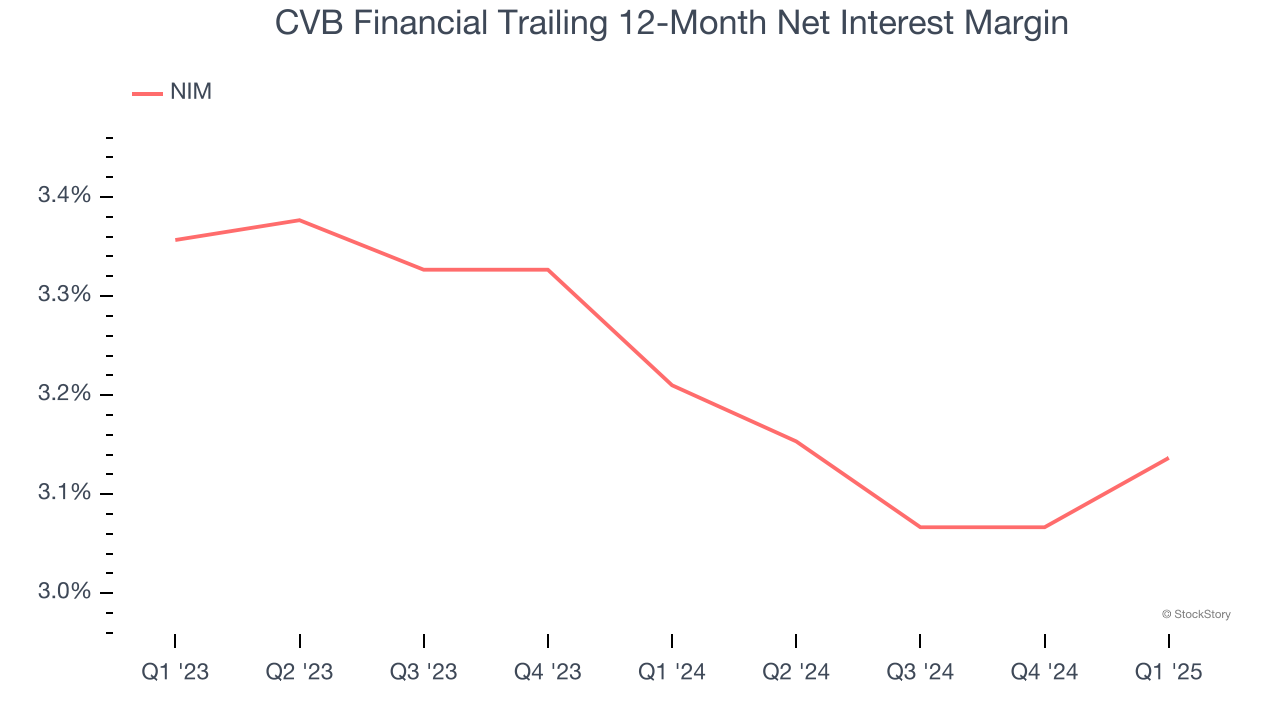
2. Net Interest Margin Dropping
Revenue is a fine reference point for banks, but net interest income and margin are better indicators of business quality for banks because they’re balance sheet-driven businesses that leverage their assets to generate profits.
Over the past two years, CVB Financial’s net interest margin averaged 3.2%. Its margin also contracted by 22 basis points (100 basis points = 1 percentage point) over that period.
This decline was a headwind for its net interest income. While prevailing rates are a major determinant of net interest margin changes over time, the decline could mean CVB Financial either faced competition for loans and deposits or experienced a negative mix shift in its balance sheet composition.
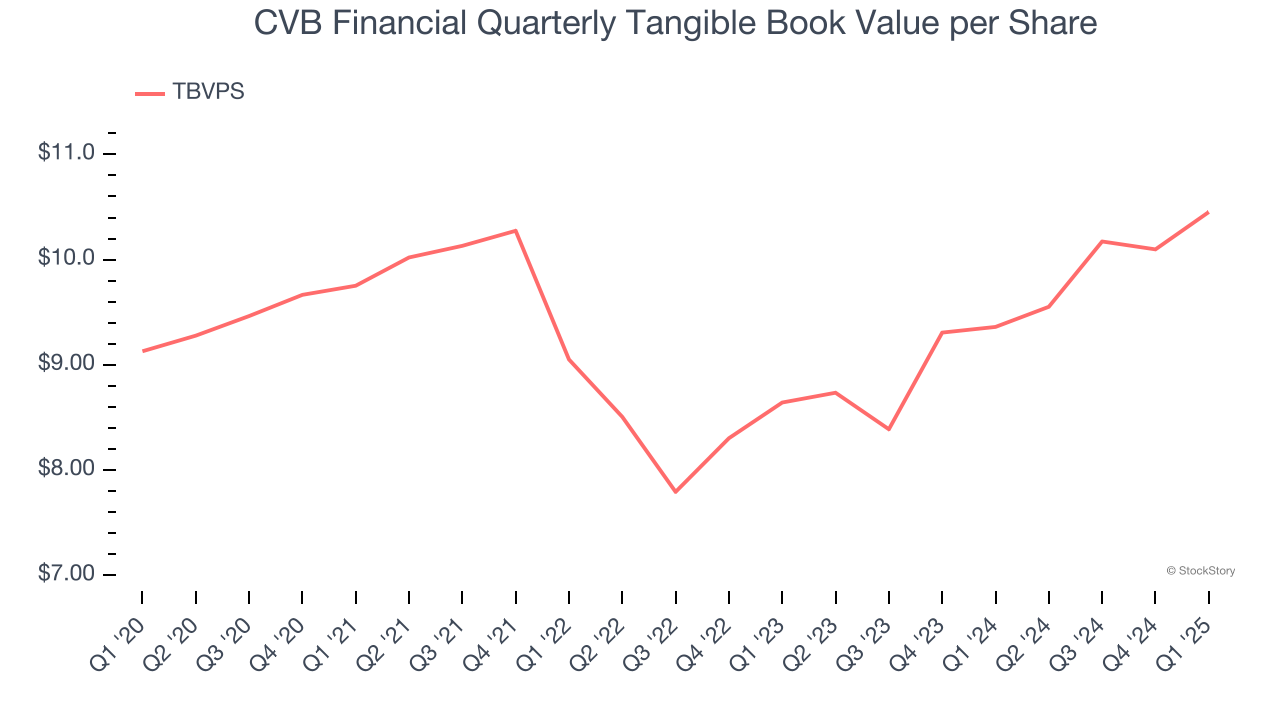
3. Substandard TBVPS Growth Indicates Limited Asset Expansion
We consider tangible book value per share (TBVPS) the most important metric to track for banks. TBVPS represents the real, liquid net worth per share of a bank, excluding intangible assets that have debatable value upon liquidation.
Disappointingly for investors, CVB Financial’s TBVPS grew at a mediocre 10% annual clip over the last two years.
Final Judgment
CVB Financial falls short of our quality standards. Following the recent decline, the stock trades at 1.1× forward P/B (or $18.15 per share). This valuation tells us a lot of optimism is priced in - you can find better investment opportunities elsewhere. Let us point you toward our favorite semiconductor picks and shovels play.
High-Quality Stocks for All Market Conditions
Donald Trump’s victory in the 2024 U.S. Presidential Election sent major indices to all-time highs, but stocks have retraced as investors debate the health of the economy and the potential impact of tariffs.
While this leaves much uncertainty around 2025, a few companies are poised for long-term gains regardless of the political or macroeconomic climate, like our Top 9 Market-Beating Stocks. This is a curated list of our High Quality stocks that have generated a market-beating return of 183% over the last five years (as of March 31st 2025).
Stocks that made our list in 2020 include now familiar names such as Nvidia (+1,545% between March 2020 and March 2025) as well as under-the-radar businesses like the once-micro-cap company Kadant (+351% five-year return). Find your next big winner with StockStory today.