Over the past six months, Latham’s stock price fell to $5.92. Shareholders have lost 17.8% of their capital, which is disappointing considering the S&P 500 has climbed by 1.7%. This might have investors contemplating their next move.
Is there a buying opportunity in Latham, or does it present a risk to your portfolio? Check out our in-depth research report to see what our analysts have to say, it’s free.
Why Is Latham Not Exciting?
Even though the stock has become cheaper, we're cautious about Latham. Here are three reasons why you should be careful with SWIM and a stock we'd rather own.
1. Long-Term Revenue Growth Flatter Than a Pancake
A company’s long-term sales performance is one signal of its overall quality. Any business can put up a good quarter or two, but many enduring ones grow for years. Unfortunately, Latham struggled to consistently increase demand as its $509.3 million of sales for the trailing 12 months was close to its revenue four years ago. This wasn’t a great result and is a sign of lacking business quality. 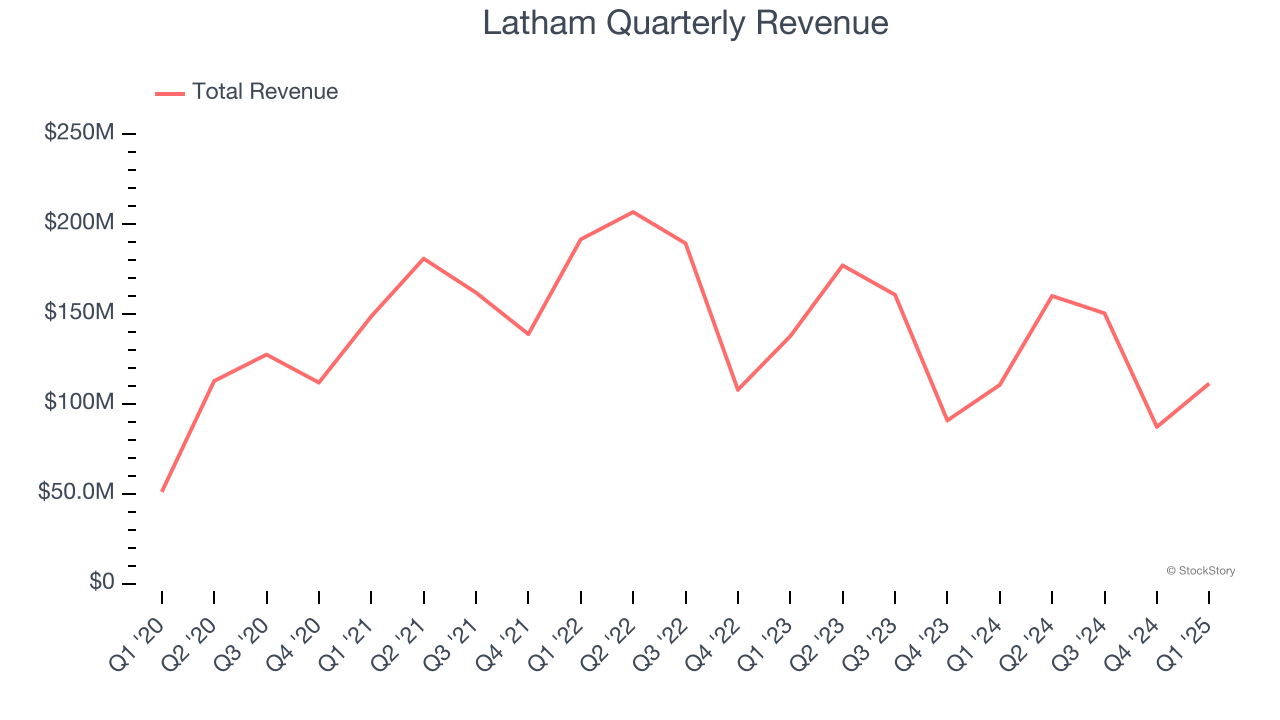
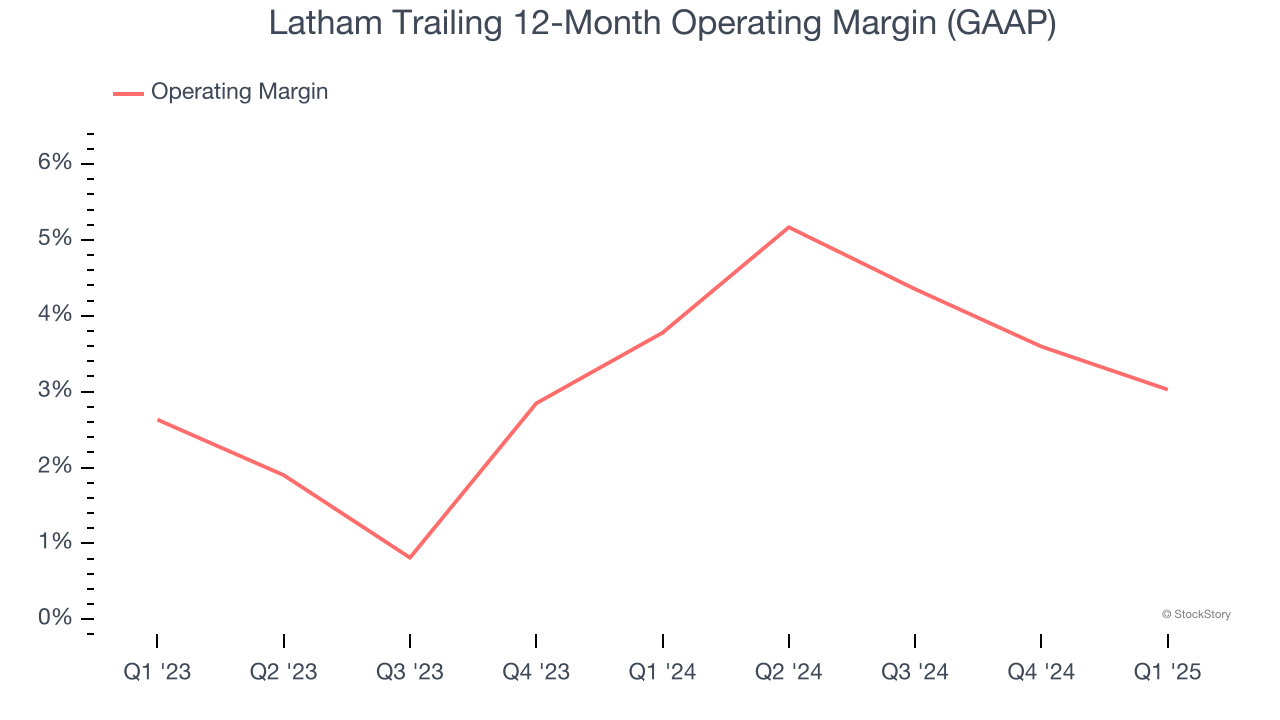
2. Weak Operating Margin Could Cause Trouble
Operating margin is an important measure of profitability as it shows the portion of revenue left after accounting for all core expenses – everything from the cost of goods sold to advertising and wages. It’s also useful for comparing profitability across companies with different levels of debt and tax rates because it excludes interest and taxes.
Latham’s operating margin might fluctuated slightly over the last 12 months but has remained more or less the same, averaging 3.4% over the last two years. This profitability was lousy for a consumer discretionary business and caused by its suboptimal cost structure.
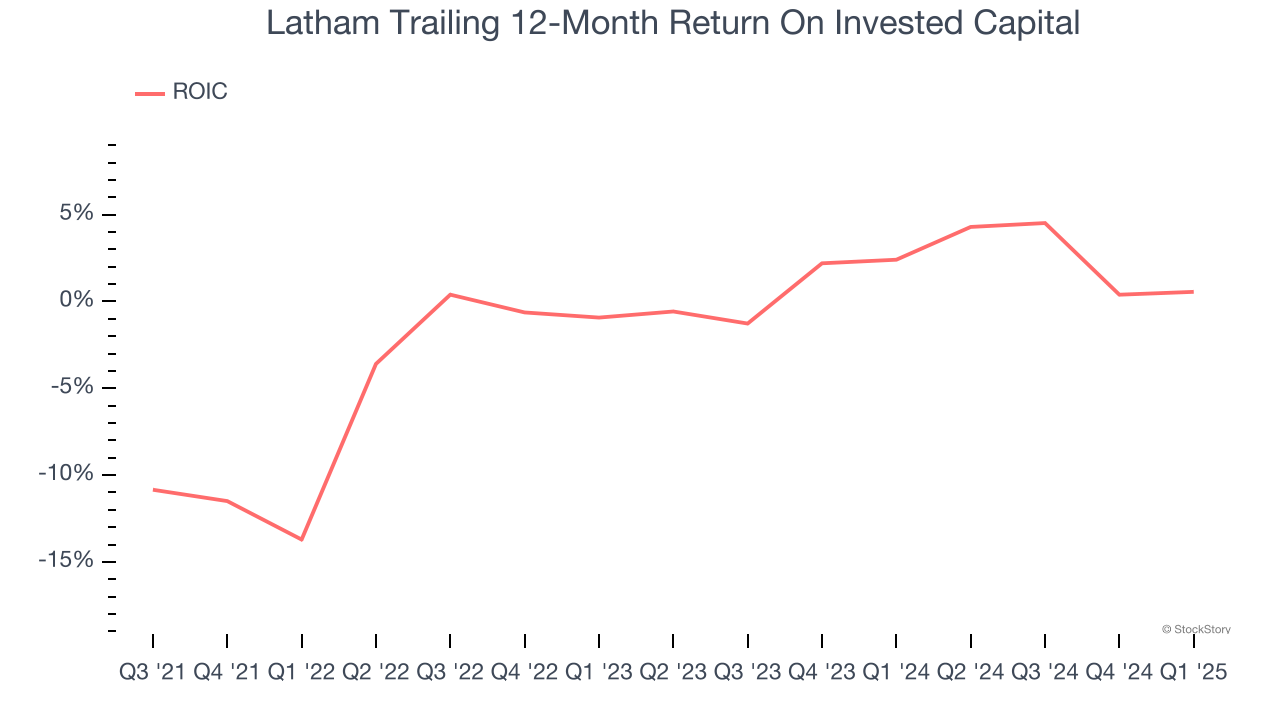
3. Previous Growth Initiatives Have Lost Money
Growth gives us insight into a company’s long-term potential, but how capital-efficient was that growth? Enter ROIC, a metric showing how much operating profit a company generates relative to the money it has raised (debt and equity).
Latham’s five-year average ROIC was negative 2.9%, meaning management lost money while trying to expand the business. Its returns were among the worst in the consumer discretionary sector.
Final Judgment
Latham isn’t a terrible business, but it doesn’t pass our bar. Following the recent decline, the stock trades at 41.2× forward P/E (or $5.92 per share). This multiple tells us a lot of good news is priced in - we think there are better opportunities elsewhere. Let us point you toward the most dominant software business in the world.
Stocks We Would Buy Instead of Latham
Donald Trump’s victory in the 2024 U.S. Presidential Election sent major indices to all-time highs, but stocks have retraced as investors debate the health of the economy and the potential impact of tariffs.
While this leaves much uncertainty around 2025, a few companies are poised for long-term gains regardless of the political or macroeconomic climate, like our Top 6 Stocks for this week. This is a curated list of our High Quality stocks that have generated a market-beating return of 183% over the last five years (as of March 31st 2025).
Stocks that made our list in 2020 include now familiar names such as Nvidia (+1,545% between March 2020 and March 2025) as well as under-the-radar businesses like the once-small-cap company Comfort Systems (+782% five-year return). Find your next big winner with StockStory today.