Shareholders of HP would probably like to forget the past six months even happened. The stock dropped 25.6% and now trades at $24.15. This was partly driven by its softer quarterly results and may have investors wondering how to approach the situation.
Is there a buying opportunity in HP, or does it present a risk to your portfolio? Dive into our full research report to see our analyst team’s opinion, it’s free.
Why Do We Think HP Will Underperform?
Even though the stock has become cheaper, we don't have much confidence in HP. Here are three reasons why HPQ doesn't excite us and a stock we'd rather own.
1. Revenue Spiraling Downwards
A company’s long-term sales performance is one signal of its overall quality. Even a bad business can shine for one or two quarters, but a top-tier one grows for years. HP’s demand was weak over the last five years as its sales fell at a 1% annual rate. This was below our standards and signals it’s a low quality business. 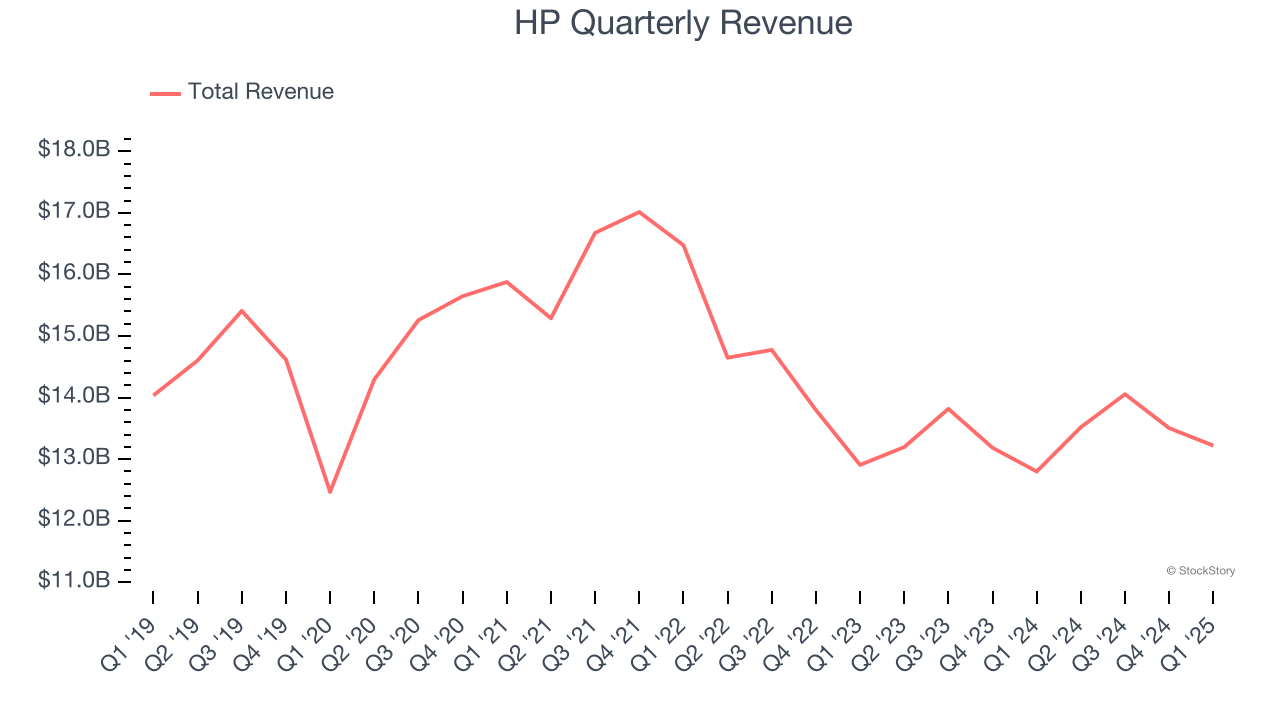
2. EPS Barely Growing
Analyzing the long-term change in earnings per share (EPS) shows whether a company's incremental sales were profitable – for example, revenue could be inflated through excessive spending on advertising and promotions.
HP’s EPS grew at an unimpressive 6.5% compounded annual growth rate over the last five years. On the bright side, this performance was better than its 1% annualized revenue declines and tells us management adapted its cost structure in response to a challenging demand environment.

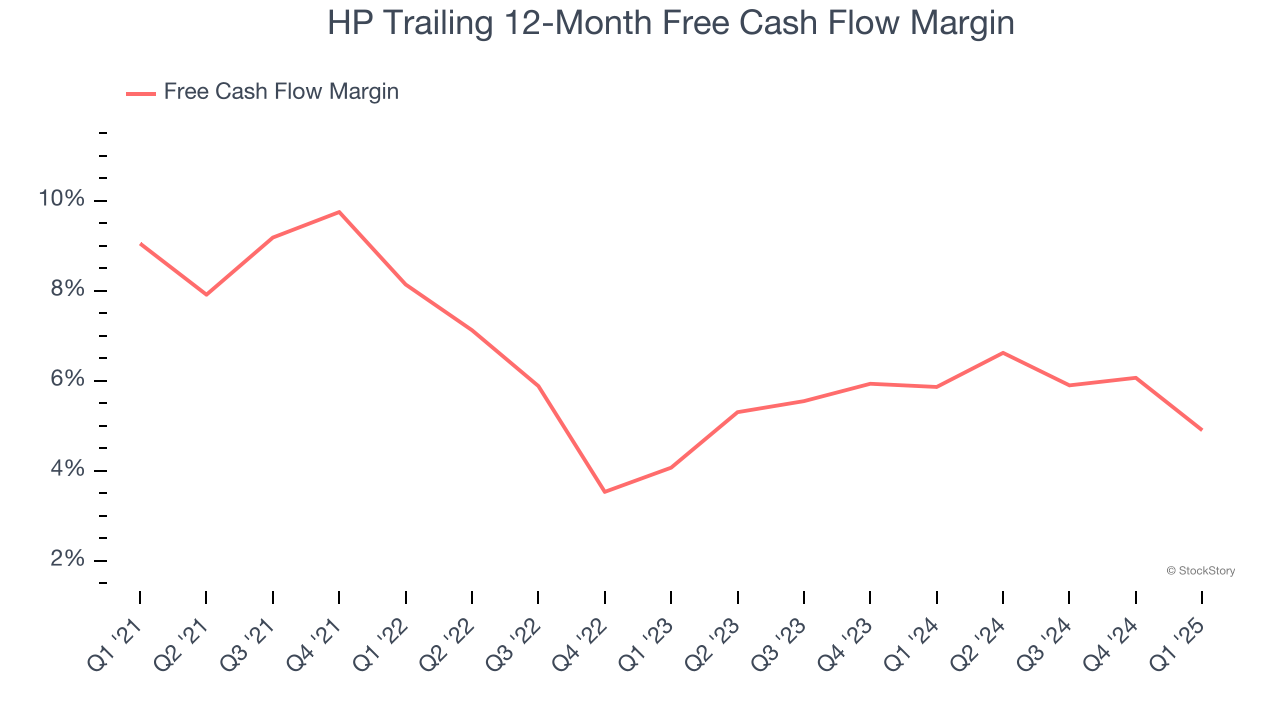
3. Free Cash Flow Margin Dropping
If you’ve followed StockStory for a while, you know we emphasize free cash flow. Why, you ask? We believe that in the end, cash is king, and you can’t use accounting profits to pay the bills.
As you can see below, HP’s margin dropped by 4.1 percentage points over the last five years. If its declines continue, it could signal increasing investment needs and capital intensity. HP’s free cash flow margin for the trailing 12 months was 4.9%.
Final Judgment
HP doesn’t pass our quality test. Following the recent decline, the stock trades at 6.7× forward P/E (or $24.15 per share). While this valuation is optically cheap, the potential downside is huge given its shaky fundamentals. There are superior stocks to buy right now. We’d recommend looking at one of Charlie Munger’s all-time favorite businesses.
Stocks We Would Buy Instead of HP
Donald Trump’s victory in the 2024 U.S. Presidential Election sent major indices to all-time highs, but stocks have retraced as investors debate the health of the economy and the potential impact of tariffs.
While this leaves much uncertainty around 2025, a few companies are poised for long-term gains regardless of the political or macroeconomic climate, like our Top 5 Growth Stocks for this month. This is a curated list of our High Quality stocks that have generated a market-beating return of 183% over the last five years (as of March 31st 2025).
Stocks that made our list in 2020 include now familiar names such as Nvidia (+1,545% between March 2020 and March 2025) as well as under-the-radar businesses like the once-micro-cap company Kadant (+351% five-year return). Find your next big winner with StockStory today.