Quarterly earnings results are a good time to check in on a company’s progress, especially compared to its peers in the same sector. Today we are looking at Skechers (NYSE: SKX) and the best and worst performers in the footwear industry.
Before the advent of the internet, styles changed, but consumers mainly bought shoes by visiting local brick-and-mortar shoe, department, and specialty stores. Today, not only do styles change more frequently as fads travel through social media and the internet but consumers are also shifting the way they buy their goods, favoring omnichannel and e-commerce experiences. Some footwear companies have made concerted efforts to adapt while those who are slower to move may fall behind.
The 8 footwear stocks we track reported a strong Q1. As a group, revenues beat analysts’ consensus estimates by 1.4% while next quarter’s revenue guidance was in line.
In light of this news, share prices of the companies have held steady. On average, they are relatively unchanged since the latest earnings results.
Skechers (NYSE: SKX)
Synonymous with "dad shoe", Skechers (NYSE: SKX) is a footwear company renowned for its comfortable, stylish, and affordable shoes for all ages.
Skechers reported revenues of $2.41 billion, up 7.1% year on year. This print fell short of analysts’ expectations by 0.9%. Overall, it was a mixed quarter for the company with a solid beat of analysts’ EPS estimates but a slight miss of analysts’ constant currency revenue estimates.
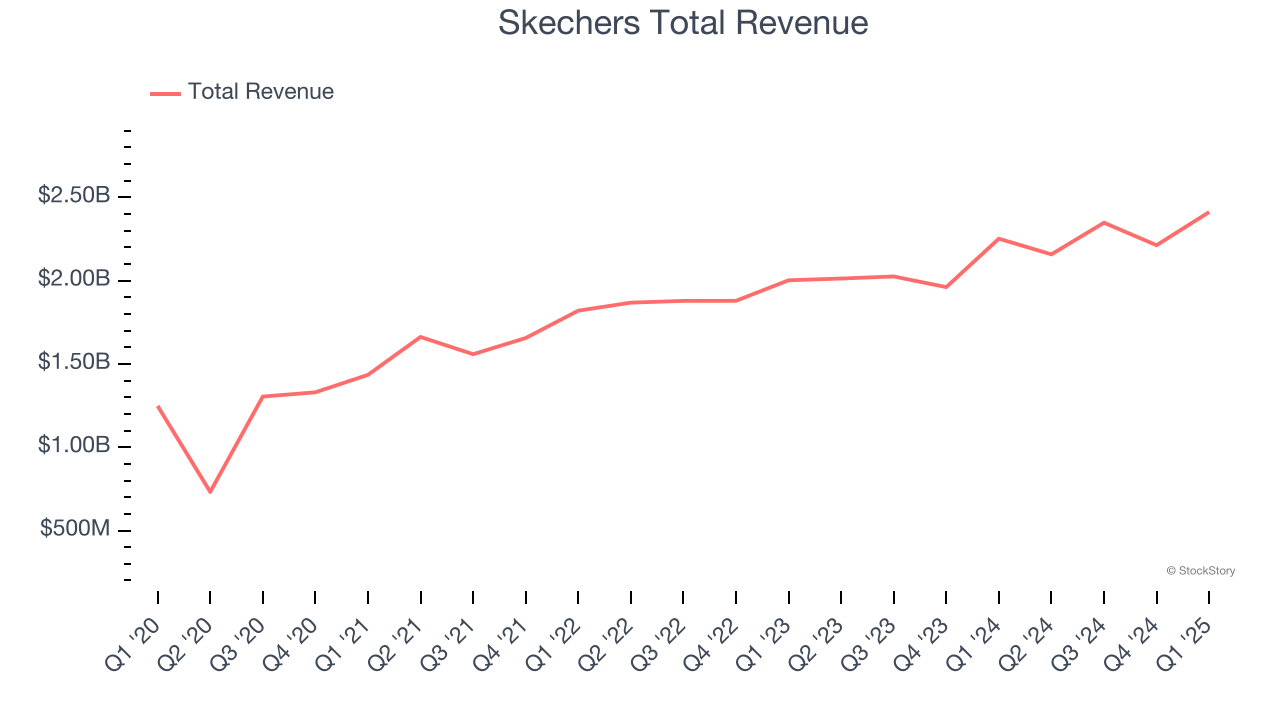
Skechers achieved the fastest revenue growth of the whole group. Unsurprisingly, the stock is up 23.7% since reporting and currently trades at $62.40.
Is now the time to buy Skechers? Access our full analysis of the earnings results here, it’s free.
Best Q1: Nike (NYSE: NKE)
Originally selling Japanese Onitsuka Tiger sneakers as Blue Ribbon Sports, Nike (NYSE: NKE) is a global titan in athletic footwear, apparel, equipment, and accessories.
Nike reported revenues of $11.27 billion, down 9.3% year on year, outperforming analysts’ expectations by 2.3%. The business had a stunning quarter with an impressive beat of analysts’ EPS estimates and a solid beat of analysts’ EBITDA estimates.
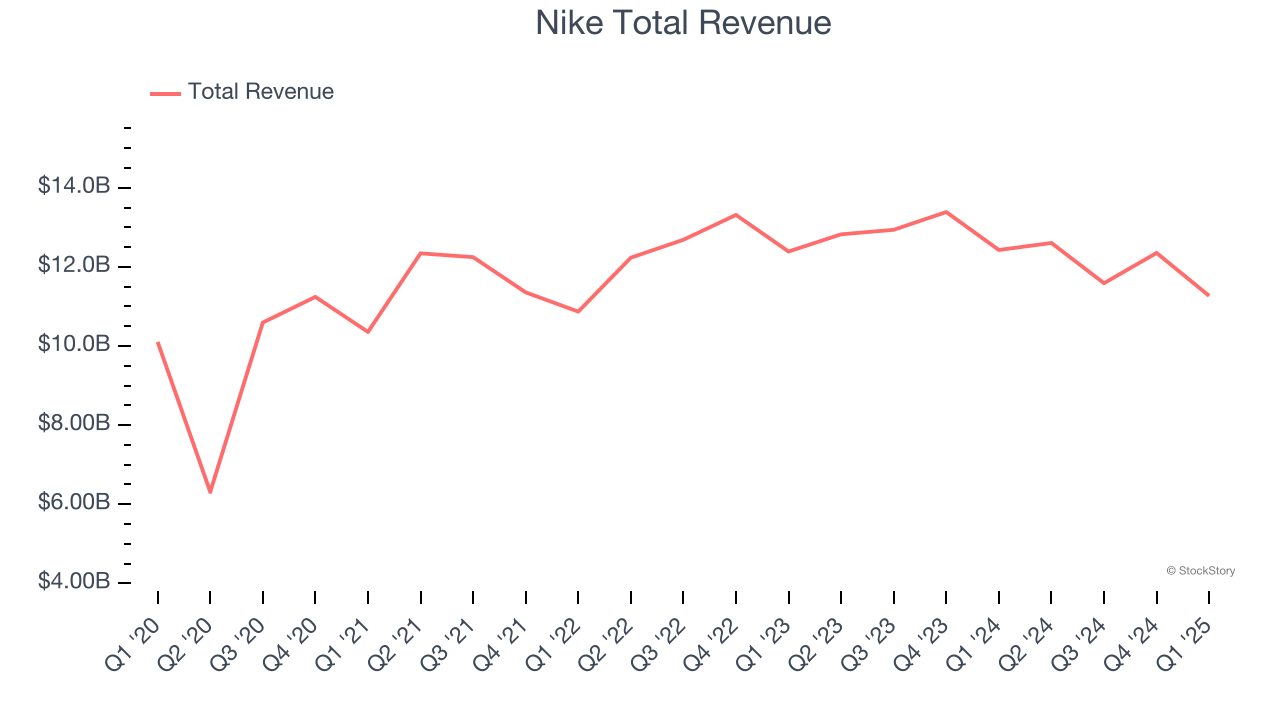
Although it had a fine quarter compared its peers, the market seems unhappy with the results as the stock is down 17% since reporting. It currently trades at $59.60.
Is now the time to buy Nike? Access our full analysis of the earnings results here, it’s free.
Weakest Q1: Caleres (NYSE: CAL)
The owner of Dr. Scholl's, Caleres (NYSE: CAL) is a footwear company offering a range of styles.
Caleres reported revenues of $614.2 million, down 6.8% year on year, falling short of analysts’ expectations by 1.3%. It was a disappointing quarter as it posted a significant miss of analysts’ adjusted operating income and EPS estimates.
Caleres delivered the weakest performance against analyst estimates in the group. As expected, the stock is down 19.9% since the results and currently trades at $13.13.
Read our full analysis of Caleres’s results here.
Deckers (NYSE: DECK)
Established in 1973, Deckers (NYSE: DECK) is a footwear and apparel conglomerate with a portfolio of lifestyle and performance brands.
Deckers reported revenues of $1.02 billion, up 6.5% year on year. This number beat analysts’ expectations by 2.4%. It was a strong quarter as it also produced a solid beat of analysts’ constant currency revenue and EPS estimates.
The stock is down 20% since reporting and currently trades at $101.00.
Read our full, actionable report on Deckers here, it’s free.
Crocs (NASDAQ: CROX)
Founded in 2002, Crocs (NASDAQ: CROX) sells casual footwear and is known for its iconic clog shoe.
Crocs reported revenues of $937.3 million, flat year on year. This print surpassed analysts’ expectations by 3.1%. Overall, it was a very strong quarter as it also logged an impressive beat of analysts’ constant currency revenue estimates and an impressive beat of analysts’ EPS estimates.
The stock is flat since reporting and currently trades at $100.45.
Read our full, actionable report on Crocs here, it’s free.
Market Update
In response to the Fed’s rate hikes in 2022 and 2023, inflation has been gradually trending down from its post-pandemic peak, trending closer to the Fed’s 2% target. Despite higher borrowing costs, the economy has avoided flashing recessionary signals. This is the much-desired soft landing that many investors hoped for. The recent rate cuts (0.5% in September and 0.25% in November 2024) have bolstered the stock market, making 2024 a strong year for equities. Donald Trump’s presidential win in November sparked additional market gains, sending indices to record highs in the days following his victory. However, debates continue over possible tariffs and corporate tax adjustments, raising questions about economic stability in 2025.
Want to invest in winners with rock-solid fundamentals? Check out our Top 5 Quality Compounder Stocks and add them to your watchlist. These companies are poised for growth regardless of the political or macroeconomic climate.