
DXP currently trades at $80.95 and has been a dream stock for shareholders. It’s returned 324% since June 2020, blowing past the S&P 500’s 91.3% gain. The company has also beaten the index over the past six months as its stock price is up 9.9%.
Is it too late to buy DXPE? Find out in our full research report, it’s free.
Why Does DXP Spark Debate?
Founded during the emergence of Big Oil in Texas, DXP (NASDAQ: DXPE) provides pumps, valves, and other industrial components.
Two Positive Attributes:
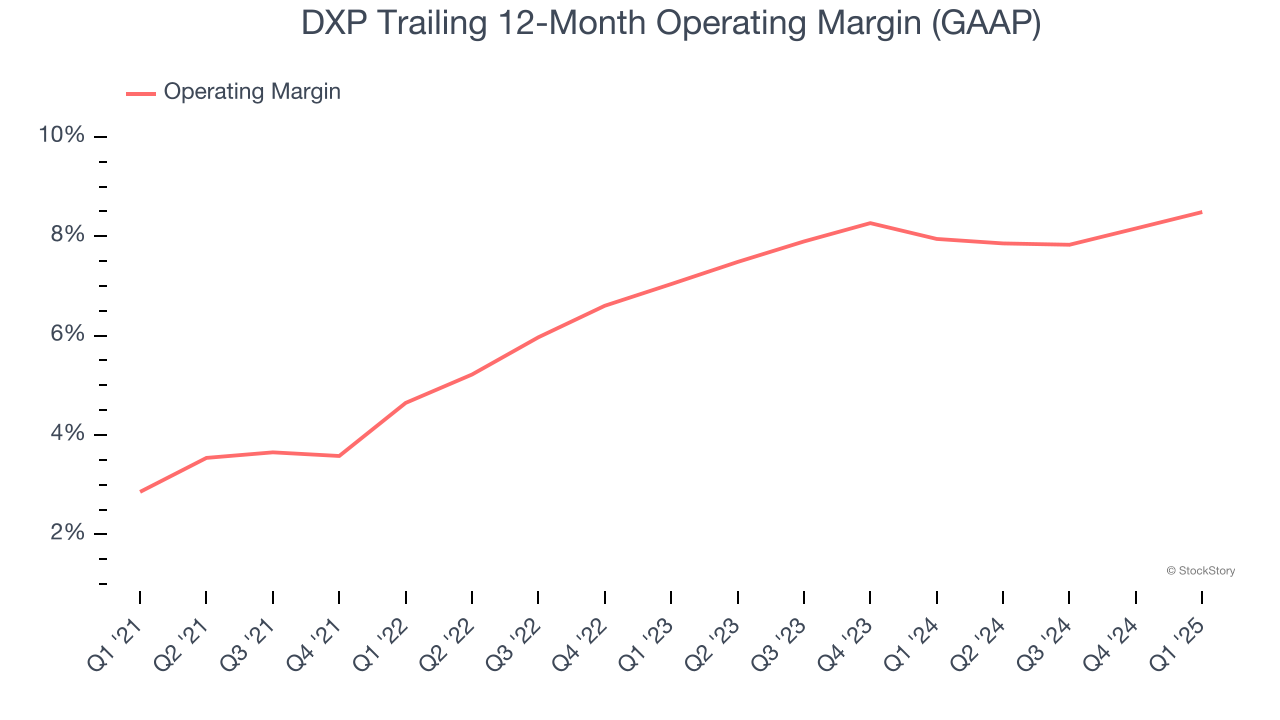
1. Operating Margin Rising, Profits Up
Operating margin is a key measure of profitability. Think of it as net income - the bottom line - excluding the impact of taxes and interest on debt, which are less connected to business fundamentals.
DXP’s operating margin rose by 5.6 percentage points over the last five years, as its sales growth gave it immense operating leverage. Its operating margin for the trailing 12 months was 8.5%.
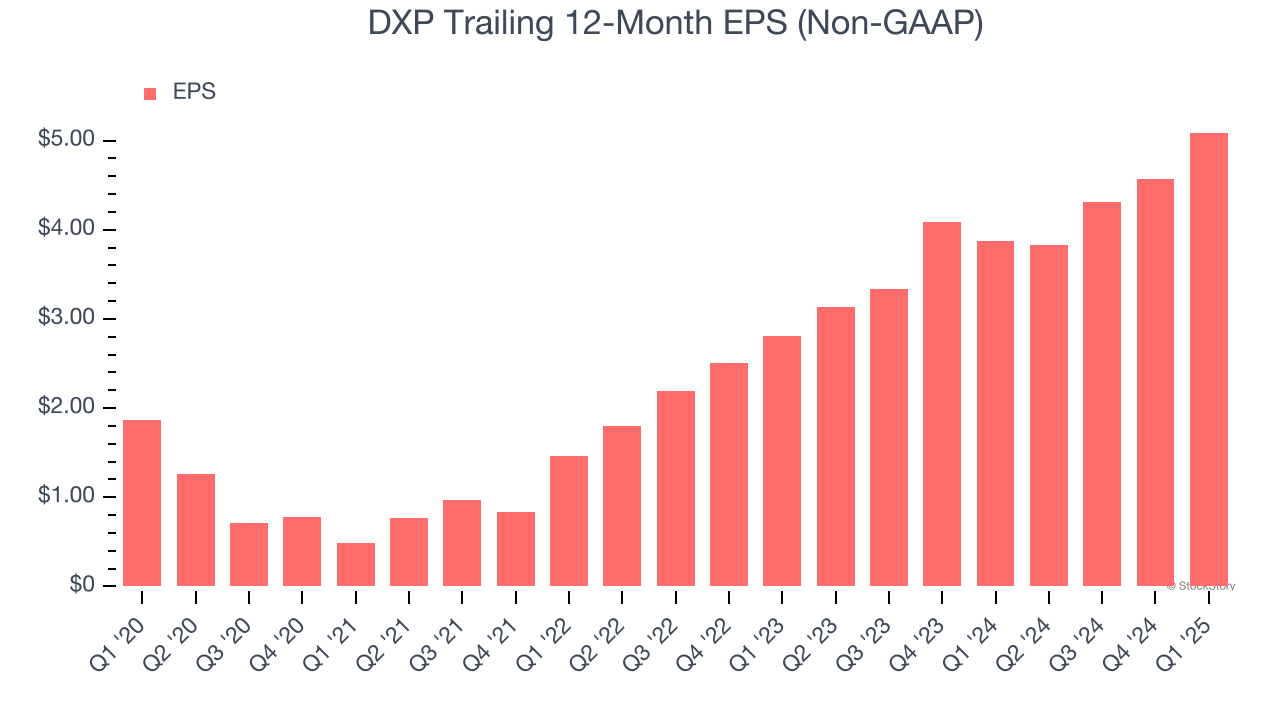
2. Outstanding Long-Term EPS Growth
We track the long-term change in earnings per share (EPS) because it highlights whether a company’s growth is profitable.
DXP’s EPS grew at an astounding 22.2% compounded annual growth rate over the last five years, higher than its 8.3% annualized revenue growth. This tells us the company became more profitable on a per-share basis as it expanded.
One Reason to be Careful:
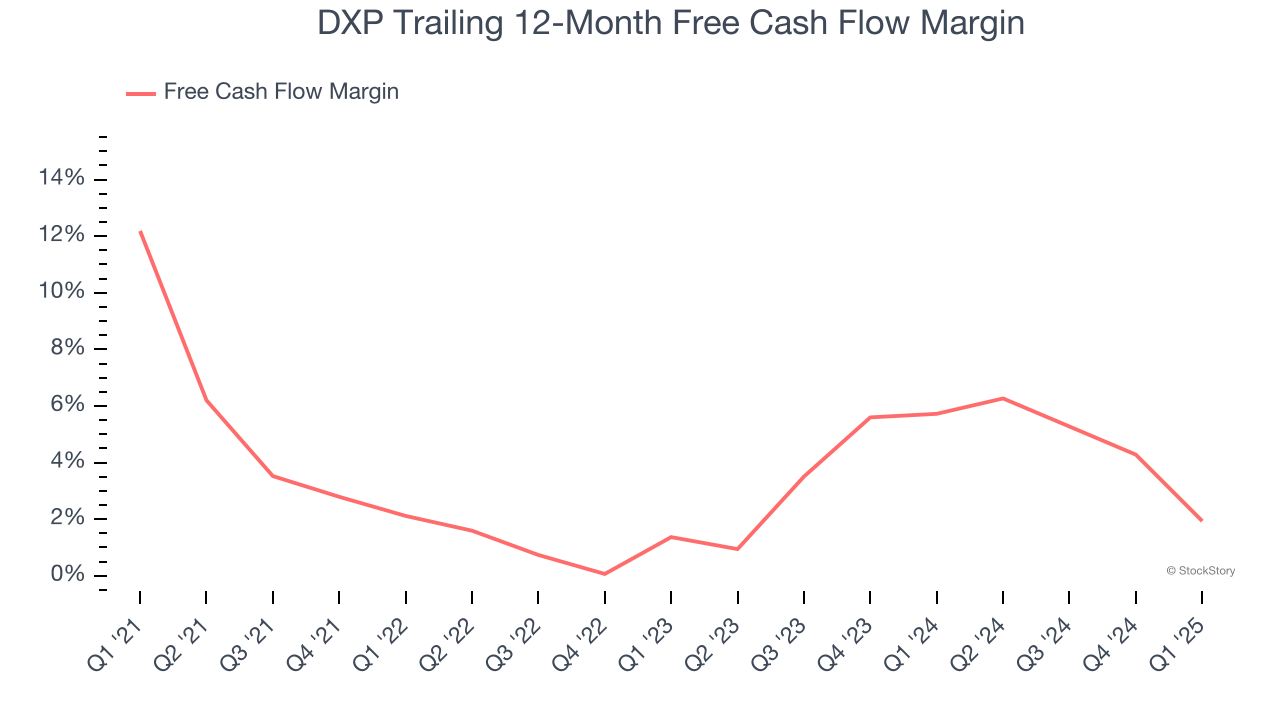
Free Cash Flow Margin Dropping
If you’ve followed StockStory for a while, you know we emphasize free cash flow. Why, you ask? We believe that in the end, cash is king, and you can’t use accounting profits to pay the bills.
As you can see below, DXP’s margin dropped by 10.2 percentage points over the last five years. If the trend continues, it could signal it’s in the middle of a big investment cycle. DXP’s free cash flow margin for the trailing 12 months was 1.9%.
Final Judgment
DXP’s positive characteristics outweigh the negatives, and with its shares topping the market in recent months, the stock trades at 15× forward P/E (or $80.95 per share). Is now the time to initiate a position? See for yourself in our comprehensive research report, it’s free.
High-Quality Stocks for All Market Conditions
Donald Trump’s victory in the 2024 U.S. Presidential Election sent major indices to all-time highs, but stocks have retraced as investors debate the health of the economy and the potential impact of tariffs.
While this leaves much uncertainty around 2025, a few companies are poised for long-term gains regardless of the political or macroeconomic climate, like our Top 5 Strong Momentum Stocks for this week. This is a curated list of our High Quality stocks that have generated a market-beating return of 183% over the last five years (as of March 31st 2025).
Stocks that made our list in 2020 include now familiar names such as Nvidia (+1,545% between March 2020 and March 2025) as well as under-the-radar businesses like the once-small-cap company Comfort Systems (+782% five-year return). Find your next big winner with StockStory today.
