
Over the last six months, United Rentals shares have sunk to $708.20, producing a disappointing 17.4% loss - worse than the S&P 500’s 2.4% drop. This might have investors contemplating their next move.
Following the drawdown, is now an opportune time to buy URI? Find out in our full research report, it’s free.
Why Does United Rentals Spark Debate?
Owning the largest rental fleet in the world, United Rentals (NYSE: URI) provides equipment rental and related services to construction, industrial, and infrastructure industries.
Two Positive Attributes:
1. Skyrocketing Revenue Shows Strong Momentum
A company’s long-term sales performance is one signal of its overall quality. Any business can put up a good quarter or two, but many enduring ones grow for years. Luckily, United Rentals’s sales grew at an impressive 10.7% compounded annual growth rate over the last five years. Its growth beat the average industrials company and shows its offerings resonate with customers. 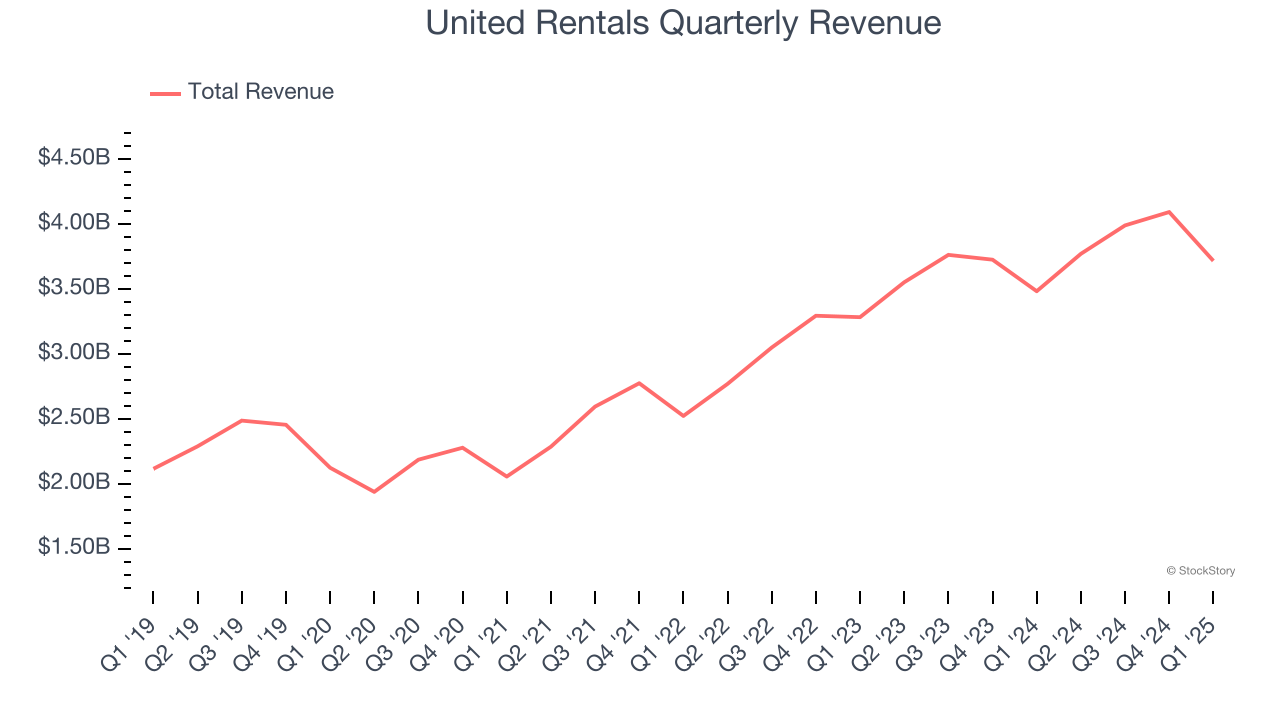
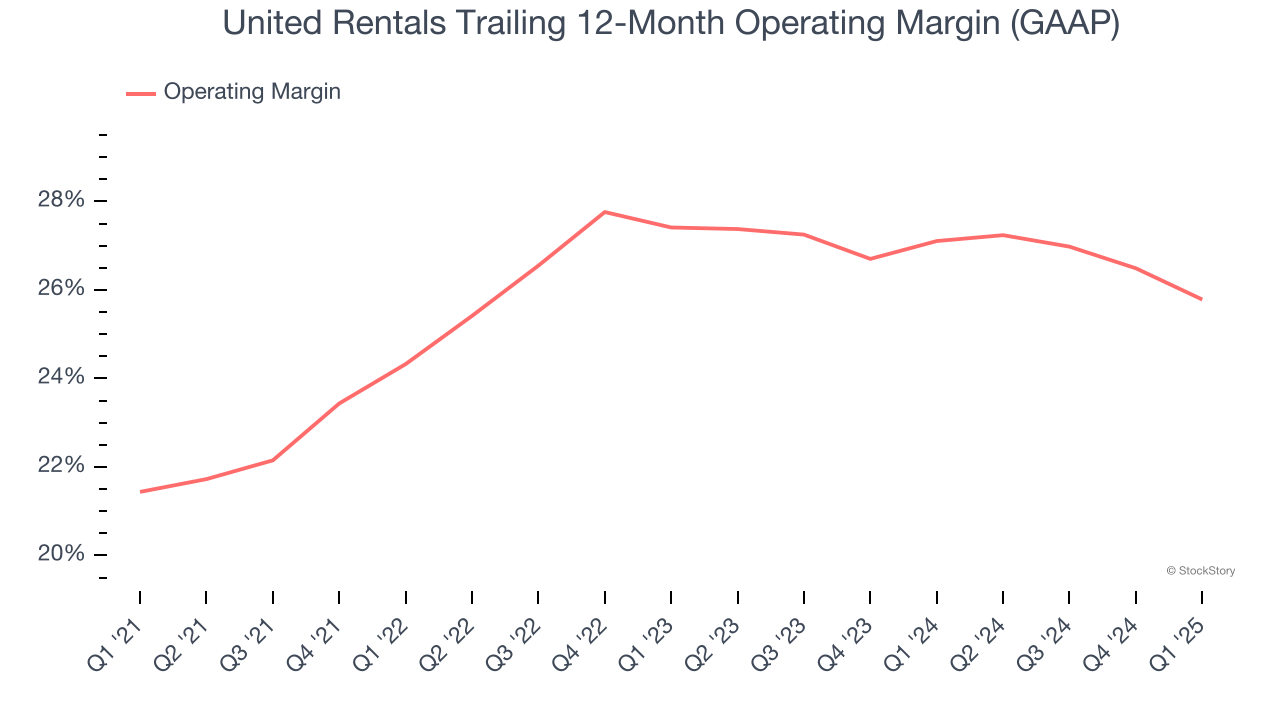
2. Operating Margin Reveals a Well-Run Organization
Operating margin is an important measure of profitability as it shows the portion of revenue left after accounting for all core expenses – everything from the cost of goods sold to advertising and wages. It’s also useful for comparing profitability across companies with different levels of debt and tax rates because it excludes interest and taxes.
United Rentals has been a well-oiled machine over the last five years. It demonstrated elite profitability for an industrials business, boasting an average operating margin of 25.6%. This result isn’t surprising as its high gross margin gives it a favorable starting point.
One Reason to be Careful:
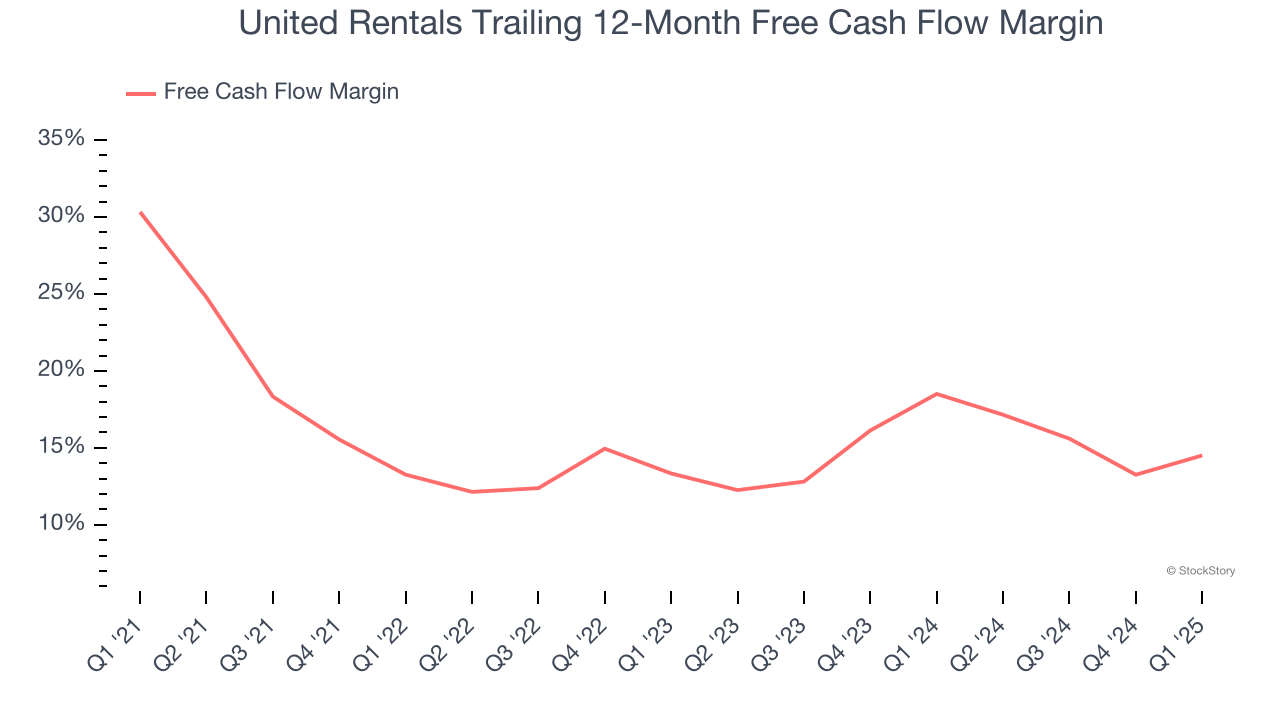
Free Cash Flow Margin Dropping
If you’ve followed StockStory for a while, you know we emphasize free cash flow. Why, you ask? We believe that in the end, cash is king, and you can’t use accounting profits to pay the bills.
As you can see below, United Rentals’s margin dropped by 15.8 percentage points over the last five years. If its declines continue, it could signal increasing investment needs and capital intensity. United Rentals’s free cash flow margin for the trailing 12 months was 14.5%.
Final Judgment
United Rentals has huge potential even though it has some open questions. With the recent decline, the stock trades at 15.9× forward P/E (or $708.20 per share). Is now a good time to initiate a position? See for yourself in our in-depth research report, it’s free.
High-Quality Stocks for All Market Conditions
Market indices reached historic highs following Donald Trump’s presidential victory in November 2024, but the outlook for 2025 is clouded by new trade policies that could impact business confidence and growth.
While this has caused many investors to adopt a "fearful" wait-and-see approach, we’re leaning into our best ideas that can grow regardless of the political or macroeconomic climate. Take advantage of Mr. Market by checking out our Top 6 Stocks for this week. This is a curated list of our High Quality stocks that have generated a market-beating return of 183% over the last five years (as of March 31st 2025).
Stocks that made our list in 2020 include now familiar names such as Nvidia (+1,545% between March 2020 and March 2025) as well as under-the-radar businesses like the once-micro-cap company Tecnoglass (+1,754% five-year return). Find your next big winner with StockStory today.
