Companies with more cash than debt can be financially resilient, but that doesn’t mean they’re all strong investments. Some lack leverage because they struggle to grow or generate consistent profits, making them unattractive borrowers.
Just because a business has cash doesn’t mean it’s a good investment. Luckily, StockStory is here to help you separate the winners from the losers. That said, here is one company with a net cash position that can continue growing sustainably and two that may struggle.
Two Stocks to Sell:
Movado (MOV)
Net Cash Position: $111.2 million (32.5% of Market Cap)
With its watches displayed in 20 museums around the world, Movado (NYSE: MOV) is a watchmaking company with a portfolio of watch brands and accessories.
Why Should You Dump MOV?
- Annual revenue declines of 6% over the last two years indicate problems with its market positioning
- Operating margin of 4.4% falls short of the industry average, and the smaller profit dollars make it harder to react to unexpected market developments
- Shrinking returns on capital suggest that increasing competition is eating into the company’s profitability
Movado’s stock price of $15.38 implies a valuation ratio of 0.5x trailing 12-month price-to-sales. Dive into our free research report to see why there are better opportunities than MOV.
Proto Labs (PRLB)
Net Cash Position: $94.22 million (10.4% of Market Cap)
Pioneering the concept of online quoting and manufacturing for custom prototypes and low-volume production parts, Proto Labs (NYSE: PRLB) offers injection molding, 3D printing, and sheet metal fabrication for manufacturers in various industries.
Why Do We Avoid PRLB?
- Sales were flat over the last two years, indicating it’s failed to expand this cycle
- Costs have risen faster than its revenue over the last five years, causing its operating margin to decline by 7.3 percentage points
- Earnings per share have contracted by 10.5% annually over the last five years, a headwind for returns as stock prices often echo long-term EPS performance
At $38.02 per share, Proto Labs trades at 25.8x forward P/E. To fully understand why you should be careful with PRLB, check out our full research report (it’s free).
One Stock to Watch:
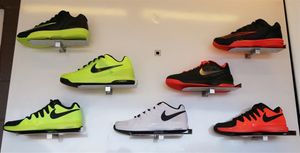
Deckers (DECK)
Net Cash Position: $1.61 billion (10.7% of Market Cap)
Established in 1973, Deckers (NYSE: DECK) is a footwear and apparel conglomerate with a portfolio of lifestyle and performance brands.
Why Does DECK Stand Out?
- Strong consumer demand for its brand drove 18.5% annual revenue growth over the last five years, outperforming sector peers
- Share buybacks catapulted its annual earnings per share growth to 31.3%, which outperformed its revenue gains over the last five years
- Improving returns on capital reflect management’s ability to monetize investments
Deckers is trading at $101.00 per share, or 16.1x forward P/E. Is now a good time to buy? Find out in our full research report, it’s free.
High-Quality Stocks for All Market Conditions
Market indices reached historic highs following Donald Trump’s presidential victory in November 2024, but the outlook for 2025 is clouded by new trade policies that could impact business confidence and growth.
While this has caused many investors to adopt a "fearful" wait-and-see approach, we’re leaning into our best ideas that can grow regardless of the political or macroeconomic climate. Take advantage of Mr. Market by checking out our Top 5 Growth Stocks for this month. This is a curated list of our High Quality stocks that have generated a market-beating return of 183% over the last five years (as of March 31st 2025).
Stocks that made our list in 2020 include now familiar names such as Nvidia (+1,545% between March 2020 and March 2025) as well as under-the-radar businesses like the once-small-cap company Comfort Systems (+782% five-year return). Find your next big winner with StockStory today for free. Find your next big winner with StockStory today. Find your next big winner with StockStory today